Economy
What’s behind the explosive growth in Canadian university costs?

From the Macdonald Laurier Institute
By David Clinton for Inside Policy
Dramatic increases in high-end employment costs have been a significant driver of rising university costs.
We’ve probably all seen reports describing out-of-control higher education costs in the United States. An education that in the 1970s could be financed with some savings and a part-time job at the local Burger King will now cost you the equivalent of a down payment on a multi-family investment property.
Those increases are not just the result of regular inflation. When you track US college costs against consumer goods (as the economist Mark J. Perry did), you’ll see that, besides healthcare, rising college-related expenses are unlike anything else.
What changed? The word on the street is that those crazy tuition costs are mostly due to colleges hiring vast armies of non-teaching administrators.
But what about Canadian universities? Back in 2006–07, according to Statistics Canada, across all Canadian universities the average inflation-adjusted cost of one year’s undergraduate tuition was $17,363. Fast forward to 2023–24 – and that same tuition-only cost has now doubled to $34,628.
Note how I referred to those numbers as “costs.” That’s because $34,628 is what you’ll pay if you’re an international student without scholarships. Thanks to government subsidies, Canadians get a big discount. In fact, the average domestic student currently pays only $6,434. But it’s taxpayers who cover the difference.
So, tuition is rising far faster than inflation. But figuring out what’s behind those increases will take some work.
The rise of the university administrator
As the chart shows, since 2001, teaching jobs have dropped from accounting for 17.38 percent of all university positions down to 14.52 percent in 2022. In other words, universities are, proportionally, hiring teaching staff at significantly lower rates than they used to. But please do keep that “proportional” bit in the back of your mind, as we’ll come back to it later.

Source: Statistics Canada/The Audit
However, those numbers don’t tell us who universities are hiring instead of teaching staff. Perhaps they’re building up their food services, security, and custodial crews?
There is at least one identifiable subgroup that’s visibly ballooned: education support services. That North American Industry Classification System category (NAICS Code 6117) includes educational consultants, student exchange program coordinators, testing services, research and development, guidance counsellors, and tutoring and exam preparation services.
Since 2001, the proportion of support services staff in relation to all hires has more than doubled, from 1.06 percent to 2.62 percent. Their absolute numbers across Canada rose from 3,829 to 15,292. (Statistics Canada offers plenty of data and insights on the topics raised in this article. For further investigation, go here, here, and here).
That’s certainly an interesting trend. But an increase of just 1.5 percent isn’t enough to explain the tuition growth we’ve experienced. And I’m also not sure that the “education support services” category maps directly to the class of high-earning administrator they’re talking about in the US. It looks like we could use some more data.
Tracking Salary Changes in Ontario Universities
The year 1996 saw a welcome victory for government transparency when Ontario’s then-Progressive Conservative Premier Mike Harris mandated the annual disclosure of all public sector employees earning more than $100,000. Since that year, the Sunshine List, as it’s popularly known, has grown from just 4,500 names to more than 300,000. However, $100,000 won’t buy you what it once did – especially if you must live in Toronto.
Perhaps we could bring those numbers up to date. Using the Bank of Canada’s inflation calculator, I identified the inflation-adjusted value of 100,000 1996 dollars for 2003 and for 2023. I then identified the individuals on the list who were employed by universities in 2003 and in 2023 and whose salaries were above the inflation-adjusted thresholds. The new thresholds, by the way, were $117,000 for 2003 and $175,000 in 2023.
The first thing that hits you when you see the adjusted data is the explosive growth in hiring. Ontario universities (not including colleges) employed 2,191 individuals earning more than $117,000 in 2003. Twenty years later, the number of employees earning more than $175,000 had ballooned to 8,536. That’s 290 percent growth. The number of people with “dean” in their job description climbed from 195 to 488 during those years. And there are now 6,772 professors on the high earners’ list as opposed to just 1,782 back in 2003.
For context, Statistics Canada tells us that there were 397,776 students enrolled in Ontario universities in 2003 and 579,057 in 2022 (the latest year for which data is available). That’s an increase of 46 percent – which doesn’t justify the 60 percent jump we’ve seen in high-paid deans and the 74 percent increase in similarly high-paid professors.
I think things are starting to come into focus.
Now let’s find out what happened to salaries. Did you know that there’s a strategic management professor who’s earning more than $650,000 annually? And what about that hybrid dean/lecturer who’s pulling in close to $600,000?
Okay… those are probably outliers, and there isn’t much we can learn from them. However, I can tell you that the average university employee in our Sunshine List earned $140,660 back in 2003. Twenty years later, the inflation-adjusted equivalent of that salary would be $211,887. But in the real world – the one that those on the public payroll graciously agree to share with us – the average 2023 university employee on the list earned $220,404. That’s a difference of only 4 percent or so, but that’s after we already accounted for inflation.
Perhaps I can illustrate this another way. The sum of all university salaries above the $117,000 threshold in 2003 was around $308 million. In 2023 dollars, that would equal $464 million. But the actual sum of all 2023 salaries above $175,000 was $1.8 billion (with a “B”)!
So, yes, tuition has doubled since 2006–07. And it seems that dramatic increases in high-end employment costs have been a significant driver. As the taxpayers paying for most of this, there’s a question that we must ask ourselves: has the epic growth in university employment delivered value to Ontario – and to all Canada – at a scale that justifies those costs? In other words, are the students now graduating from Canadian schools equipped to successfully enter a demanding job market, navigate a fractured political environment, and strengthen weakened communities? Recent scenes from campus protests suggest that might not be the case.
David Clinton is the publisher of The Audit (www.theaudit.ca), a journal of data-driven policy analysis. He is also the author of books on data tools, cloud and Linux administration, and IT security.
From the Frontier Centre for Public Policy
By Lee Harding
Trump’s protectionism has jolted Canada into finally beginning to tear down interprovincial trade barriers
The threat of Donald Trump’s tariffs and the potential collapse of North American free trade have prompted Canada to look inward. With international trade under pressure, the country is—at last—taking meaningful steps to improve trade within its borders.
Canada’s Constitution gives provinces control over many key economic levers. While Ottawa manages international trade, the provinces regulate licensing, certification and procurement rules. These fragmented regulations have long acted as internal trade barriers, forcing companies and professionals to navigate duplicate approval processes when operating across provincial lines.
These restrictions increase costs, delay projects and limit job opportunities for businesses and workers. For consumers, they mean higher prices and fewer choices. Economists estimate that these barriers hold back up to $200 billion of Canada’s economy annually, roughly eight per cent of the country’s GDP.
Ironically, it wasn’t until after Canada signed the North American Free Trade Agreement that it began to address domestic trade restrictions. In 1994, the first ministers signed the Agreement on Internal Trade (AIT), committing to equal treatment of bidders on provincial and municipal contracts. Subsequent regional agreements, such as Alberta and British Columbia’s Trade, Investment and Labour Mobility Agreement in 2007, and the New West Partnership that followed, expanded cooperation to include broader credential recognition and enforceable dispute resolution.
In 2017, the Canadian Free Trade Agreement (CFTA) replaced the AIT to streamline trade among provinces and territories. While more ambitious in scope, the CFTA’s effectiveness has been limited by a patchwork of exemptions and slow implementation.
Now, however, Trump’s protectionism has reignited momentum to fix the problem. In recent months, provincial and territorial labour market ministers met with their federal counterpart to strengthen the CFTA. Their goal: to remove longstanding barriers and unlock the full potential of Canada’s internal market.
According to a March 5 CFTA press release, five governments have agreed to eliminate 40 exemptions they previously claimed for themselves. A June 1 deadline has been set to produce an action plan for nationwide mutual recognition of professional credentials. Ministers are also working on the mutual recognition of consumer goods, excluding food, so that if a product is approved for sale in one province, it can be sold anywhere in Canada without added red tape.
Ontario Premier Doug Ford has signalled that his province won’t wait for consensus. Ontario is dropping all its CFTA exemptions, allowing medical professionals to begin practising while awaiting registration with provincial regulators.
Ontario has partnered with Nova Scotia and New Brunswick to implement mutual recognition of goods, services and registered workers. These provinces have also enabled direct-to-consumer alcohol sales, letting individuals purchase alcohol directly from producers for personal consumption.
A joint CFTA statement says other provinces intend to follow suit, except Prince Edward Island and Newfoundland and Labrador.
These developments are long overdue. Confederation happened more than 150 years ago, and prohibition ended more than a century ago, yet Canadians still face barriers when trying to buy a bottle of wine from another province or find work across a provincial line.
Perhaps now, Canada will finally become the economic union it was always meant to be. Few would thank Donald Trump, but without his tariffs, this renewed urgency to break down internal trade barriers might never have emerged.
Lee Harding is a research fellow with the Frontier Centre for Public Policy.

From the Fraser Institute
By Tegan Hill
Amid the tariff war, the price of West Texas Intermediate oil—a common benchmark—recently dropped below US$60 per barrel. Given every $1 drop in oil prices is an estimated $750 million hit to provincial revenues, if oil prices remain low for long, there could be big implications for Alberta’s budget.
The Smith government already projects a $5.2 billion budget deficit in 2025/26 with continued deficits over the following two years. This year’s deficit is based on oil prices averaging US$68.00 per barrel. While the budget does include a $4 billion “contingency” for unforeseen events, given the economic and fiscal impact of Trump’s tariffs, it could quickly be eaten up.
Budget deficits come with costs for Albertans, who will already pay a projected $600 each in provincial government debt interest in 2025/26. That’s money that could have gone towards health care and education, or even tax relief.
Unfortunately, this is all part of the resource revenue rollercoaster that’s are all too familiar to Albertans.
Resource revenue (including oil and gas royalties) is inherently volatile. In the last 10 years alone, it has been as high as $25.2 billion in 2022/23 and as low as $2.8 billion in 2015/16. The provincial government typically enjoys budget surpluses—and increases government spending—when oil prices and resource revenue is relatively high, but is thrown into deficits when resource revenues inevitably fall.
Fortunately, the Smith government can mitigate this volatility.
The key is limiting the level of resource revenue included in the budget to a set stable amount. Any resource revenue above that stable amount is automatically saved in a rainy-day fund to be withdrawn to maintain that stable amount in the budget during years of relatively low resource revenue. The logic is simple: save during the good times so you can weather the storm during bad times.
Indeed, if the Smith government had created a rainy-day account in 2023, for example, it could have already built up a sizeable fund to help stabilize the budget when resource revenue declines. While the Smith government has deposited some money in the Heritage Fund in recent years, it has not created a dedicated rainy-day account or introduced a similar mechanism to help stabilize provincial finances.
Limiting the amount of resource revenue in the budget, particularly during times of relatively high resource revenue, also tempers demand for higher spending, which is only fiscally sustainable with permanently high resource revenues. In other words, if the government creates a rainy-day account, spending would become more closely align with stable ongoing levels of revenue.
And it’s not too late. To end the boom-bust cycle and finally help stabilize provincial finances, the Smith government should create a rainy-day account.


The Federal Brief That Should Sink Carney
How Canada’s Mainstream Media Lost the Public Trust

Ottawa Confirms China interfering with 2025 federal election: Beijing Seeks to Block Joe Tay’s Election

Real Homes vs. Modular Shoeboxes: The Housing Battle Between Poilievre and Carney
-
2025 Federal Election3 hours ago
The Federal Brief That Should Sink Carney
-
2025 Federal Election5 hours ago
How Canada’s Mainstream Media Lost the Public Trust
-
2025 Federal Election8 hours ago
Ottawa Confirms China interfering with 2025 federal election: Beijing Seeks to Block Joe Tay’s Election
-
2025 Federal Election7 hours ago
Real Homes vs. Modular Shoeboxes: The Housing Battle Between Poilievre and Carney
-
 John Stossel4 hours ago
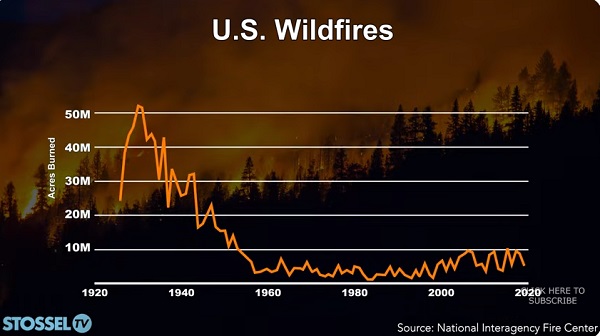
Climate Change Myths Part 2: Wildfires, Drought, Rising Sea Level, and Coral Reefs
-
 COVID-196 hours ago
Nearly Half of “COVID-19 Deaths” Were Not Due to COVID-19 – Scientific Reports Journal
-
 2025 Federal Election2 days ago
Poilievre’s Conservatives promise to repeal policy allowing male criminals in female jails
-
 2025 Federal Election2 days ago
Polls say Canadians will give Trump what he wants, a Carney victory.