Economy
We’re Getting Poorer: GDP per Capita in Canada and the OECD

From the Fraser Institute
By Alex Whalen and Milagros Palacios and Lawrence Schembri
Canada lost ground compared to key allies and trading partners such as the United States, United Kingdom, New Zealand, and Australia between 2014 and 2022.
Canada had the third-lowest growth in GDP per person from 2014 to 2022 among 30 advanced economies, finds a new study published by the Fraser Institute, an independent, non-partisan Canadian public policy think-tank.
“In terms of GDP per person, a broad measure of living standards, Canada’s performance has weakened substantially in recent years,” said Alex Whalen, director of the Fraser Institute’s Atlantic Canada Prosperity Initiative and co-author of We’re Getting Poorer: GDP per Capita in Canada and the OECD, 2002–2060.
The study, which examines Canada’s historic and projected GDP per capita growth compared to similar OECD countries, finds that from 2002 to 2014, Canadian income growth as measured by GDP per person roughly kept pace with the rest of the OECD, but from 2014 to 2022 Canada’s growth rate stagnated.

In 2002, Canada’s GDP per capita was higher than the OECD average by US$3,141. By 2022, it had fallen well below the OECD average by US$231. Canada lost ground compared to key allies and trading partners such as the United
States, United Kingdom, New Zealand, and Australia between 2014 and 2022.
For example, Canadian GDP per person in 2014 was $44,710 (80.4 per cent of the US total of $55,605) but by 2022, Canada was only at $46,035 versus $63,685 in the US. In other words, the gap had grown from $10,895 to $17,649 by 2022 (all measures in inflation-adjusted US dollars).

“Canada has been experiencing a collapse in investment, low productivity growth, and a large and growing government sector, all of which contribute to reduced growth in living standards compared to our peer countries in the OECD,” said Lawrence Schembri, a senior fellow with the Fraser Institute and co-author.
- This research bulletin examines historical and projected trends in the growth of Canada’s GDP per capita, and compares these trends to those in peer countries in the OECD.
- Canadians have been getting poorer relative to residents of other countries in the OECD. From 2002 to 2014, Canadian income growth as measured by GDP per capita roughly kept pace with the rest of the OECD. From 2014 to 2022, however, Canada’s position declined sharply, ranking third-lowest among 30 countries for average growth over the period.
- Between 2012 and 2022, Canada lost ground compared to key allies and trading partners such as the United States, United Kingdom, New Zealand, and Australia, with Canadian GDP per capita declining from 80.4% of the US level in 2012 to 72.3% in 2022.
- Looking forward to 2060, Canada’s projected average annual growth rate for GDP per capita (0.78%) is the lowest among 30 OECD countries.
- Canada’s GDP per capita (after adjusting by inflation), which exceeded the OECD average by US$3,141 in 2002 and was roughly equivalent to the OECD average in 2022, is projected to fall below the OECD average by US$8,617 in 2060.
- The root cause of Canada’s declining long-term growth in GDP per capita—recent and projected—is very low or negative growth in labour productivity reflecting weak investment in physical and human capital per worker.
Authors:


![]()
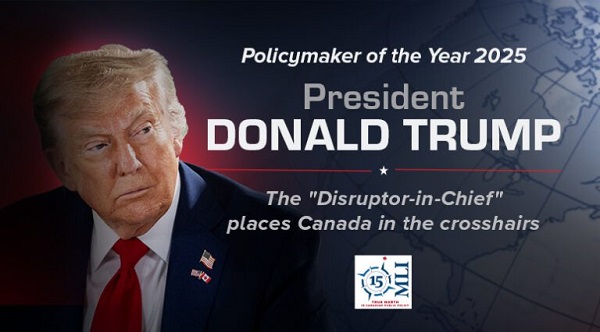
Not for the first time, the Macdonald-Laurier Institute’s Policymaker of the Year is not a Canadian.
In 2019, our laureate was Xi Jinping, leader of the People’s Republic of China, whose long arm reached far into many aspects of policymaking in our nation’s capital.
That helps to underline our intention in conferring this recognition. Policy influence can be used to Canada’s benefit or detriment. In naming our annual Policymaker of the Year, MLI does not endorse their policies; instead, we seek to draw to the attention of Canadians those people who have had the most influence on public policy in this country – for good or ill – in the past year.
And in 2025, who can deny that US President Donald Trump, the Disruptor-in-Chief, has exercised an outsized influence on Canadians – on their hopes and fears, on their political preferences, and, most importantly for our purposes, on the policies pursued by the Canadian government?
How has Donald Trump spurred policy change in Canada? Let us count the ways:
First, set aside for the moment any focus on specific policy areas and just think about the President’s style and strategy. Anyone who has read The Art of the Deal knows that Trump is quite straightforward in avowing that his dealmaking strategy sets out to frighten and intimidate the other party with a degree of unpredictability, bravado, and unwillingness to be bound by past assumptions that is sometimes just breathtaking to contemplate.
On the other hand, what on the surface appears to his opponents as simply irrational is in fact nothing of the sort. He sets out to frighten and intimidate, but he also sets out to get deals done, which cannot happen with negotiating partners paralyzed by fear. And in fact, the list of deals he has done in less than a year in office is impressive: NATO members have made big commitments to increase defence spending, the war in Gaza is paused by a (shaky) ceasefire of his design, trade deals have been struck with many partners, including the EU, the UK, Mexico, and even China … though notably, not with Canada.
Here at home, Trump has riled Canadians with his comments about annexation and disputed borders, laid a heavy finger on the 2025 electoral scales, and met repeatedly with Prime Minister Mark Carney – but equally repeatedly sent him on his way with little to show for the Prime Minister’s efforts as supplicant. Policies that seemed settled, like our purchase of the F-35 fighter jet, our deep integration with the US economy, and our feeble attempts at even-handedness in the conflict in the Middle East, all seem to have fallen victim to Ottawa’s ill-advised urge to stick a finger in Donald Trump’s eye, whatever the cost.
Like it or not, Trump has reminded Canadians in no uncertain terms that America is the elephant and we are, if not exactly a mouse, certainly a beast whose wellbeing depends on American forbearance and good will. The question of whether we can calm the rampaging elephant and charm him into a better humour or fall back on much less profitable relations with other countries far away is THE question that will preoccupy policymakers in Ottawa this year and for several years to come.
It is against this backdrop that several major dimensions of Canada-US relations have been thrust into the spotlight – none more dramatically than trade.
Weaponized Tariffs and Fractured Trade
Tim Sargent
For many Canadians, Donald Trump’s re-election on November 5, 2024, while not a cause for celebration, was also not an existential threat to our economy. After all, when Trump was first elected in 2016, his threats to tear up the North American Free Trade Agreement (NAFTA) ultimately came to nothing, and the new version of NAFTA that was negotiated by the US, Canada, and Mexico (we call it CUSMA, the Americans call it USMCA), was broadly similar to its predecessor, with almost all Canadian goods able to enter the US market tariff-free.
That complacency was almost immediately shattered when the President, even before his inauguration, announced his intent to slap a tariff of 25 per cent on Canadian (and Mexican exports), supposedly in response to Canada’s failure to stop fentanyl from crossing over the US border. The shock was rapid, and the implications unmistakable.
Once in office, Trump made good on his threat and imposed the 25 per cent tariff on all Canadian exports except energy, which was subject to “only” a 10 per cent tariff. The sheer interconnectedness of the North American economy forced Trump to partially back down and exempt CUSMA-compliant goods from the tariffs. However, because they raised input costs for US manufacturers, Trump opened another front by slapping tariffs on steel, aluminum, autos, copper, lumber, and furniture in the name of national security, overriding the CUSMA treaty that he had signed. While these tariffs apply to all countries, these are all commodities for which Canadian exporters are very dependent on the US market, and which are very important for the Canadian economy.
While trade disputes with the US have not been unknown since the signing of the original Canada-US Free Trade Agreement in 1988 – softwood lumber is the most obvious example – no one expected Trump to take aim at the whole Canada–US trading relationship, which accounts for almost a quarter of our GDP. This escalation marks a break not just with economic norms but with decades of strategic restraint.
None of this augers well for the negotiations for the renewal of CUSMA, which are supposed to conclude in the summer of 2026, or the broader Canada-US trading relationship. Indeed, it is not clear that the renewal document will be worth the paper it is written on, given that Trump has shown no compunction in violating the terms of the original agreement. Perhaps even more fundamentally, the President, reflecting a broader strand of America-first nationalism, simply does not see trade as a mutually beneficial activity; rather, it is a zero-sum game in which the only way for the US to win is for others to lose. The fact that basic economics says the opposite seems to be neither here nor there.
All this leaves Canadian policymakers with some unpleasant alternatives. While the Carney government originally attempted to retaliate by imposing tariffs of its own, the reality is that these are pinpricks to the US, for which Canadian exports are only a few percentage points of GDP. Furthermore, tariffs hurt Canadian consumers. The other alternative, which the government is now pursuing, is to diversify Canada’s trade away from the US. However, Canadian governments have been trying to reduce their reliance on the United States since at least the 1970s, with little success. Geography and economic gravity continue to dominate: the US will always be the most obvious market for our exports, even with tariffs.
Perhaps the most that Canadians can hope for is that Americans will, as has happened in the past, come to realize that a close and stable trading relationship with Canada is in their national interest just as much as it is in ours.
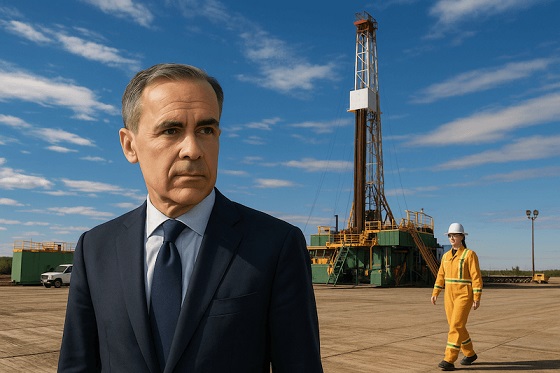
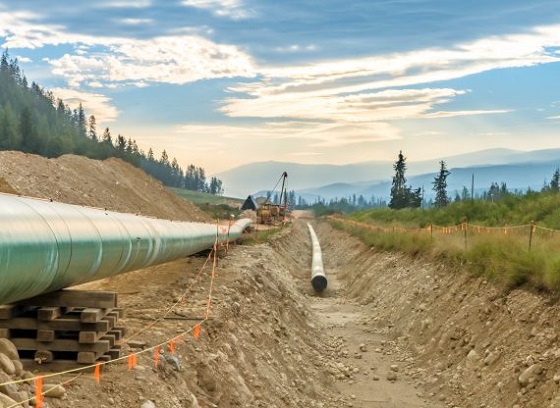
Trade Tensions Fuel Canadian Oil Revival
Heather Exner-Pirot
Donald Trump’s tariffs and threat to the Canadian economy have meaningfully shifted both the public understanding and attitude towards oil and gas. Perhaps in the past it could be seen simply as something Alberta produced, an embarrassing source of global emissions. After 2025, it became clear how essential oil production is both to our economic health and our global standing.
Oil is Canada’s largest export, and most of it goes to the United States. When Trump declared in January 2025 that “we don’t need their oil and gas. We have more than anybody,” it was a tell. Canadian oil and gas is precisely the thing we produce that the United States needs more than anything else. In fact, that same month the US imported a record amount of Canadian crude oil: 4.27 million barrels; the most any country has ever imported from another in the history of the world.
This newfound appreciation of oil and its geopolitical importance brought a long-dead idea back to life: an oil pipeline to the northwest coast of British Columbia, the value of which has always been in diversifying our market for heavy oil from the US to Asia. The source of hard fought culture wars in the 2010s before being approved in 2014, rejected by Trudeau in 2018, and handed the final indignity of a tanker ban in 2019, a Northern Gateway-type pipeline is now not only possible, but even likely. In every public opinion poll in 2025, such a pipeline has enjoyed majority support. It is the centrepiece of the landmark MOU between the federal and Alberta government that has as an explicit goal increasing oil and gas production.
Canada has always had the resources of an energy superpower. Trump’s threats have done more to give us the ambition of one than anyone or anything before him.
“Elbows up” and the New Anti-American Nationalism
Mark Reid
Donald Trump’s return to the White House drastically altered the course of Canadian politics. The ensuing fallout – fuelled by threats of tariffs and incendiary “51st state” rhetoric – became the key catalyst that propelled Mark Carney’s Liberals to victory on an “elbows up” platform.
This resurgent Canadian nationalism was defined by a sharp strain of anti-Americanism in general, and a profound dislike of Trump in particular.
As Trump slapped tariffs on Canada (and mused about annexing Greenland), the Prime Minister and provincial leaders promised a “Team Canada” approach to counter the President’s aggression. Canadian politicians from coast to coast earnestly vowed to remove interprovincial trade barriers, back major national projects, and present a common front.
That unity quickly faded.
Faced with new rounds of tariff threats, Carney’s government shifted to diplomatic conciliation, rolling back the Digital Sales Tax and offering border security concessions to avert economic disaster. Supporters called it pragmatism; critics called it a surrender.
Meanwhile, the Team Canada vision turned out to be a mirage. Interprovincial squabbles over a bitumen pipeline to tidewater in BC persists, while a multi-million-dollar Ontario anti-tariff ad, which aired on US television, infuriated Trump.
These internal divisions underscore a dangerous reality: Canada’s very sovereignty may be at risk. The US President’s recent “Trump Corollary” to the Monroe Doctrine clearly articulates his vision of American hegemony over the Americas, with Canada, presumably, as a sort of vassal state. The federal government now faces an impossible task – buying time in the hope that the US political climate shifts, while protecting Canadian autonomy from an American president who sees it as negotiable.
Smashing the Overton Window on social policy
Peter Copeland
Donald Trump is polarizing for good reason. He is rude, crude, lewd, and norm-breaking to an extraordinary degree: a former Manhattan Democrat and social liberal whose transgressiveness and contempt for precedent embody many of the very cultural tendencies the left has long celebrated. His impulsiveness seems to threaten alliances and raise geopolitical risks by the day – yet he now leads the most effective conservative movement in decades.
He also possesses unusual strengths. His entrepreneurial instinct has allowed him to see the gap created by an oblivious, or unwilling, left- and right- establishment political class on trade, immigration, cultural and social decline – and to seize the opportunity. His unfiltered political style contrasts sharply with the scripted, risk-averse habits of career politicians and the professional-managerial class. He seeks no validation from the Davos set or the media-academic establishment, making him unafraid to challenge orthodoxy. Trump’s rise is a sharp indictment of liberal elites on both sides of the political spectrum, who proved incapable of addressing the deep social and economic issues that he foregrounded from the outset of his presidency.
On issues like gender identity, DEI, and mass migration, rooted in an extreme open-society ideology of hyper-individualism and autonomy, establishment leaders had long been unwilling even to acknowledge the problems. Then Trump came along and threw open the Overton window on just about every issue.
For Canada, Trump’s impact is mixed. He expanded the envelope of the politically possible on topics thought untouchable just years ago, but his abrasive style has made Canadian elites – whose defining characteristic is anti-Americanism – more reluctant to pursue parallel reforms. On immigration, borders and defence, Ottawa is now moving; on gender, DEI, and education, it is retreating behind “Trump did it, so we won’t.”
Shredding Canada’s US security blanket
Richard Shimooka
President Trump’s successful upending of American foreign policy in 2025 has had profound and potentially long-term consequences, but few are as acutely felt as the changes he has forced upon the Canada-US security relationship. Trump’s actions have effectively ended the decades-long expectation that the United States would forever underwrite Canada’s defence and security, forcing a sea-change in Ottawa’s strategic calculus.
Since the Second World War, the foundation of the Canada-US security and economic relationship has been an interlocking system of security guarantees through alliances and free trade blocs. This synergistic mix, which bound states like Canada to a rules and values based international order conceived in Washington, allowed Canada to maintain a relatively small defence footprint, relying instead on overwhelming American firepower to deter its enemies.
However, Trump’s skepticism towards this foundation, evident since his first term, consolidated into decisive policy changes in his second term. By launching a devastatingly counterproductive trade war against Canada and other major trading partners and directly questioning the value of major alliances like NATO, he effectively declared America’s security commitments are no longer unconditional.
For Canada, this has meant a new urgency to foot a larger portion of the bill for continental security, a renewed focus on securing both the Canada-US border and the Arctic, and for finally meeting long-standing pledges to spend two per cent of GDP on NATO.
Ironically, while Trump’s pressure tactics have succeeding in pushing Canada (and other allies like Japan and Germany) to increase defence spending and become more self-sufficient, it comes at the cost of America’s ability to lead like-minded states. As US leverage wanes, Trump’s strategy may end up pushing America’s allies into the arms of strategic rivals like China.
Without American global leadership, states may prioritize a narrower brand of self-interest – one that is counterproductive to America’s overall strategic ends. Observe how Canada is now looking to rebuild its economic relationship with the People’s Republic of China, not merely for trade, but as a deliberate economic counterweight to its highly integrated trade relationship with the United States.
This impulse will likely be shared by many US allies. Indeed, allied nations in Southeast Asia may begin to doubt Washington’s commitment to the current geopolitical alignment and seek to balance their relationship with China. Some may even fall further into Beijing’s grasp, becoming the 21st-century equivalent of tributary states.
“Trump the Peacemaker” and the Politics of Force
Casey Babb
Donald Trump’s bold and fearless foreign policy decisions – especially regarding Israel’s war in Gaza and the broader Middle East – make him one of the most consequential and transformative political leaders in a generation. His combination of disruption, recalibration, and strategic risk-taking sought to redirect the trajectory of the Middle East in ways few leaders have attempted.
Some of these changes began during Trump’s first administration. The Abraham Accords, which normalized relations between Israel and several Arab states, reflected a shift toward open regional co-operation against shared security concerns. His decisions, like recognizing Jerusalem as Israel’s capital and cutting aid to Palestinian institutions, were commonsense corrections to what he viewed as unnecessary diplomatic ambiguities.
However, his most transformative actions in the Middle East happened in the aftermath of the October 7, 2023, Hamas terror attacks on Israel. From his 20-point plan for peace in Gaza and his efforts to bring home hostages, to the “12 Day War” between Israel and Iran, Trump made it clear that America’s support for Israel remains unwavering – signalling that Washington is willing to take decisive action in the Middle East to protect US and allied security.
Beyond the Middle East, Trump’s approach to China marked a sharp departure from previous presidents. Replacing engagement tactics with tariffs, export controls, and the framing of China as a key rival, Trump pushed for a shift in US policy that continues in his second term in office.
In Europe, Trump’s record on the Russia-Ukraine war is mixed. The President has pressured NATO allies to carry a greater load in terms of supporting Ukraine, and the US has continued to provide Kyiv with lethal military aid. However, critics worry about Trump’s personal relationship with Russian President Vladimir Putin: as the peace negotiations continue, will Ukraine eventually be sacrificed for American expediency?
Conclusion
Trump’s legacy remains unwritten. It may destabilize Western institutions, or it may be the jolt needed to shake a complacent boomer establishment out of its decadent, dogmatic slumbers.
Trump has clearly shifted the geopolitical landscape in both Canada and around the world – in ways no conventional figure could have. It is worth asking: would Europe have increased defence spending without American pressure? Would Canada have taken border security, immigration, defence, or energy policy seriously?
Even conservative governments – often differing little from liberal ones in practice – have lacked the capital or resolve to confront entrenched bureaucracies, and it remains doubtful whether any old-school Canadian libertarian-oriented fusionist, or a typical Wall Street Republican in the US, would have had what it took to win, yet alone enact the needed the reforms.
Trump was, and is, very much the man for the moment. Whether this shift leads to renewal or decline, only time will tell. Those same disruptive instincts have defined his approach to the world stage as well, reshaping geopolitics in ways Canadians cannot ignore.
Brian Lee Crowley is managing director of the Macdonald-Laurier Institute.
Tim Sargent is a senior fellow and the director of Domestic Policy at MLI.
Heather Exner-Pirot is a senior fellow and MLI’s director of Energy, Natural Resources, and the Environment.
Mark Reid is the senior editor at MLI.
Peter Copeland is the deputy director of Domestic Policy at MLI.
Richard Shimooka is a senior fellow at MLI.
Casey Babb is the director of MLI’s The Promised Land program.

This article supplied by Troy Media.
Cutting the food tax is one clear way to ease the cost-of-living crisis for Canadians
About a year ago, Canada experimented with something rare in federal policymaking: a temporary GST holiday on prepared foods.
It was short-lived and poorly communicated, yet Canadians noticed it immediately. One of the most unavoidable expenses in daily life—food—became marginally less costly.
Families felt a modest but genuine reprieve. Restaurants saw a bump in customer traffic. For a brief moment, Canadians experienced what it feels like when government steps back from taxing something as basic as eating.
Then the tax returned with opportunistic pricing, restoring a policy that quietly but reliably makes the cost of living more expensive for everyone.
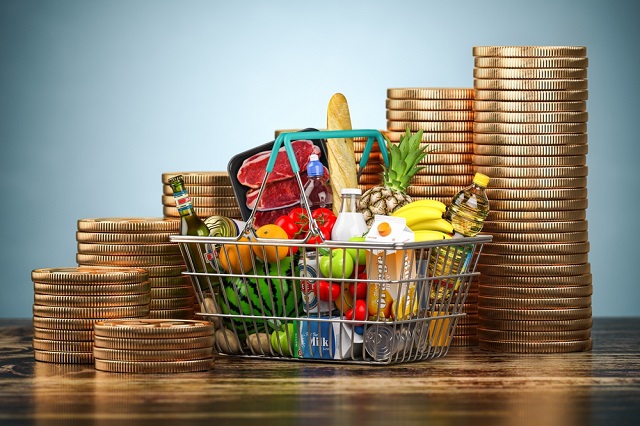
In many ways, the temporary GST cut was worse than doing nothing. It opened the door for industry to adjust prices upward while consumers were distracted by the tax relief. That dynamic helped push our food inflation rate from minus 0.6 per cent in January to almost four per cent later in the year. By tinkering with taxes rather than addressing the structural flaws in the system, policymakers unintentionally fuelled volatility. Instead of experimenting with temporary fixes, it is time to confront the obvious: Canada should stop taxing food altogether.
Start with grocery stores. Many Canadians believe food is not taxed at retail, but that assumption is wrong. While “basic groceries” are zero-rated, a vast range of everyday food products are taxed, and Canadians now pay over a billion dollars a year in GST/HST on food purchased in grocery stores.
That amount is rising steadily, not because Canadians are buying more treats, but because shrinkflation is quietly pulling more products into taxable categories. A box of granola bars with six bars is tax-exempt, but when manufacturers quietly reduce the box to five bars, it becomes taxable. The product hasn’t changed. The nutritional profile hasn’t changed. Only the packaging has changed, yet the tax flips on.
This pattern now permeates the grocery aisle. A 650-gram bag of chips shrinks to 580 grams and becomes taxable. Muffins once sold in six-packs are reformatted into three-packs or individually wrapped portions, instantly becoming taxable single-serve items. Yogurt, traditionally sold in large tax-exempt tubs, increasingly appears in smaller 100-gram units that meet the definition of taxable snacks. Crackers, cookies, trail mixes and cereals have all seen slight weight reductions that push them past GST thresholds created decades ago. Inflation raises food prices; Canada’s outdated tax code amplifies those increases.
At the same time, grocery inflation remains elevated. Prices are rising at 3.4 per cent, nearly double the overall inflation rate. At a moment when food costs are climbing faster than almost everything else, continuing to tax food—whether on the shelf or in restaurants—makes even less economic sense.
The inconsistencies extend further. A steak purchased at the grocery store carries no tax, yet a breakfast wrap made from virtually the same inputs is taxed at five per cent GST plus applicable HST. The nutritional function is not different. The economic function is not different. But the tax treatment is entirely arbitrary, rooted in outdated distinctions that no longer reflect how Canadians live or work.
Lower-income households disproportionately bear the cost. They spend 6.2 per cent of their income eating outside the home, compared with 3.4 per cent for the highest-income households. When government taxes prepared food, it effectively imposes a higher burden on those often juggling two or three jobs with limited time to cook.
But this is not only about the poorest households. Every Canadian pays more because the tax embeds itself in the price of convenience, time and the realities of modern living.
And there is an overlooked economic dimension: restaurants are one of the most effective tools we have for stimulating community-level economic activity. When people dine out, they don’t just buy food. They participate in the economy. They support jobs for young and lower-income workers. They activate foot traffic in commercial areas. They drive spending in adjacent sectors such as transportation, retail, entertainment and tourism.
A healthy restaurant sector is a signal of economic confidence; it is often the first place consumers re-engage when they feel financially secure. Taxing prepared food, therefore, is not simply a tax on convenience—it is a tax on economic participation.
Restaurants Canada has been calling for the permanent removal of GST/HST on all food, and they are right. Eliminating the tax would generate $5.4 billion in consumer savings annually, create more than 64,000 foodservice jobs, add over 15,000 jobs in related sectors and support the opening of more than 2,600 new restaurants across the country. No other affordability measure available to the federal government delivers this combination of economic stimulus and direct relief.
And Canadians overwhelmingly agree. Eighty-four per cent believe food should not be taxed, regardless of where it is purchased. In a polarized political climate, a consensus of that magnitude is rare.
Ending the GST/HST on all food will not solve every affordability issue but it is one of the simplest, fairest and most effective measures the federal government can take immediately.
Food is food. The tax system should finally accept that.
Dr. Sylvain Charlebois is a Canadian professor and researcher in food distribution and policy. He is senior director of the Agri-Food Analytics Lab at Dalhousie University and co-host of The Food Professor Podcast. He is frequently cited in the media for his insights on food prices, agricultural trends, and the global food supply chain.
Troy Media empowers Canadian community news outlets by providing independent, insightful analysis and commentary. Our mission is to support local media in helping Canadians stay informed and engaged by delivering reliable content that strengthens community connections and deepens understanding across the country.


Alberta’s huge oil sands reserves dwarf U.S. shale
Canada’s sudden rediscovery of energy ambition has been greeted with a familiar charge: hypocrisy
COP30 finally admits what resource workers already knew: prosperity and lower emissions must go hand in hand
Canada’s New Green Deal
-
 armed forces7 hours ago
Ottawa’s Newly Released Defence Plan Crosses a Dangerous Line
-
 espionage6 hours ago
Carney Floor Crossing Raises Counterintelligence Questions aimed at China, Former Senior Mountie Argues
-
 Censorship Industrial Complex2 days ago
Canadian university censors free speech advocate who spoke out against Indigenous ‘mass grave’ hoax
-
 Health5 hours ago
All 12 Vaccinated vs. Unvaccinated Studies Found the Same Thing: Unvaccinated Children Are Far Healthier
-
 Energy8 hours ago
75 per cent of Canadians support the construction of new pipelines to the East Coast and British Columbia
-
 Energy2 days ago
‘The electric story is over’
-
 International2 days ago
Georgia county admits illegally certifying 315k ballots in 2020 presidential election
-
 Business2 days ago
Some Of The Wackiest Things Featured In Rand Paul’s New Report Alleging $1,639,135,969,608 In Gov’t Waste