Canadian Energy Centre
North America LNG project cost competitiveness
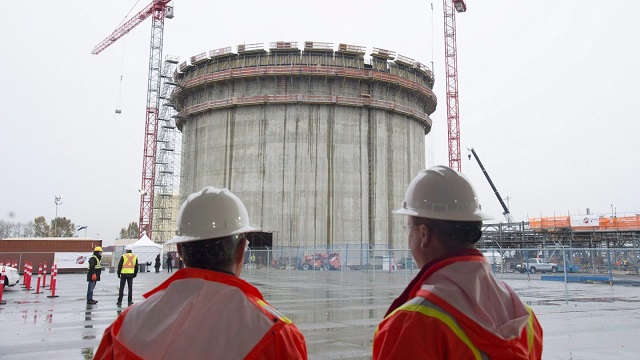


Construction workers look on at the FortisBC Tilbury LNG expansion project in Delta, B.C., Monday, Nov. 16, 2015. CP Images photo
From the Canadian Energy Centre
Lower costs for natural gas, shipping and liquefaction give Canada an edge in the emerging global LNG market
Worldwide concerns about energy security have put a renewed focus on the international liquefied natural gas (LNG) industry. The global demand for LNG is expected to increase over the next few decades.
Global demand growth will be driven primarily by Asian markets where the need for LNG is expected to increase from 277 million tonnes (MT) in 2025 to 509 MT by 2050 (see Figure 1). By 2050 the demand for LNG in Europe will be 83 MT and in Africa 20 MT. In South America too, demand will increase – from 13 MT in 2025 to 31 MT in 2050.

Source: Derived from Rystad Energy, Gas and LNG Markets Solution.
In North America (Canada, Mexico, and United States) a number of LNG projects that are either under construction or in the planning stages will benefit from the rise in global LNG demand.
North American LNG production is expected to grow from 112 MT in 2025 to over 255 MT by 2050 (see Figure 2). In Canada, the LNG projects under construction or in the planning stages include LNG Canada Phases 1 & 2, Woodfibre LNG, Cedar LNG, the Tilbury LNG expansion, and Ksi Lisims LNG. Canada’s LNG production is expected to grow from just 2 MT in 2025 to over 43 MT by 2050. In the United States production is projected to increase from 108 MT in 2025 to 210 MT in 2050.

Source: Derived from Rystad Energy, Gas and LNG Markets Solution.
This CEC Fact Sheet uses Rystad Energy’s Gas and LNG Markets Solution¹ to benchmark the cost competitiveness of LNG projects that are under construction and proposed in Canada compared to other LNG projects under construction and planned elsewhere in North America. (Note that the content of this report does not represent the views of Rystad Energy.)
The LNG cost competitiveness benchmarking analysis used the following performance metrics:
- LNG plant free-on-board (FOB) cost break-even;
- Total LNG plant cost (for delivery into Asia and Europe).
The objective of this LNG cost competitiveness benchmarking is to compare the competitiveness of Canadian LNG projects against those of major competitors in the United States and Mexico. The selection of other North American LNG facilities for the benchmark comparison with Canadian LNG projects (LNG Canada, the Tilbury LNG Expansion, Woodfibre LNG, Cedar LNG, and Ksi Lisims LNG) is based on the rationale that virtually all Canadian LNG plants are under construction or in the planning stage and that they compare well with other North American LNG plants that are also under construction or are being planned between 2023 and 2050. Further, to assess the cost competitiveness of the various LNG projects more accurately, we chose only North American LNG facilities with sufficient economic data to enable such a comparison. We compared the cost competitiveness of LNG coming from these other North American projects with LNG coming from Canada that is intended to be delivered to markets in Asia and Europe.
1. Rystad Energy is an independent energy research company providing data, analytics, and consultancy services to clients around the globe. Its Gas and LNG Markets Solution provides an overview of LNG markets worldwide. The Solution covers the entire value chain associated with gas and LNG production, country and sector-level demand, and LNG trade flows, infrastructure, economics, costs, and contracts through 2050. It allows for the evaluation of the entire LNG market infrastructure, including future planned projects, as well as the benchmarking of costs for LNG projects (Rystad Energy, 2024).
Comparison of LNG project FOB cost break-even (full cycle)
Figure 3 provides a comparison of the free-on-board (FOB) cost break-even for LNG facilities under construction or being planned in North America. FOB break-even costs include upstream and midstream costs for LNG excluding transportation costs (shipping) as seen from the current year. Break-even prices assume a discount rate of 10 percent and represent the point at which the net present value for an LNG project over a 20- to 30-year period becomes positive, including the payment of capital and operating costs, inclusive of taxes.
Among the selected group of North American LNG projects are Canadian LNG projects with an FOB break-even at the lower end of the range (US$7.18 per thousand cubic feet (kcf)) to those at the higher end (US$8.64 per thousand cubic feet (kcf)).
LNG projects in the United States tend to settle in the middle of the pack, with FOB break-even between US$6.44 per kcf and US$8.37 per kcf.
Mexico LNG projects have the widest variation in costs among the selected group of projects, ranging from US$6.94 per kcf to US$9.44 per kcf (see Figure 3).

Source: Derived from Rystad Energy, Gas and LNG Markets Solution.
Total costs by project for LNG delivery to Asia and Europe
The total cost by LNG plant includes FOB cost break-even, transportation costs, and the regasification tariff. Figure 4 compares total project costs for LNG destined for Asia from selected North American LNG facilities.
Canadian LNG projects are very cost competitive, and those with Asia as their intended market tend to cluster at the lower end of the scale. The costs vary by project, but range between US$8.10 per kcf and US$9.56 per kcf, making Canadian LNG projects among the lowest cost projects in North America.
The costs for Mexico’s LNG projects with Asia as the intended destination for their product tend to cluster in the middle of the pack. Costs among U.S. LNG facilities that plan to send their product to Asia tend to sit at the higher end of the scale, at between US$8.90 and US$10.80 per kcf.

Source: Derived from Rystad Energy, Gas and LNG Markets Solution.
Figure 5 compares total project costs for LNG to be delivered to Europe from select North American LNG facilities.
Costs from U.S. LNG facilities show the widest variation for this market at between US$7.48 per kcf and US$9.42 per kcf, but the majority of U.S. LNG facilities tend to cluster at the lower end of the cost scale, between US$7.48 per kcf and US$8.61 per kcf (see Figure 5).
Canadian projects that intend to deliver LNG to Europe show a variety of costs that tend to cluster at the middle to higher end of the spectrum, ranging from US$9.60 per kcf to and US$11.06 per kcf.
The costs of Mexico’s projects that are aimed at delivering LNG to Europe tend to cluster in the middle of the spectrum (US$9.11 per kcf to US$10.61 per kcf).

Source: Derived from Rystad Energy, Gas and LNG Markets Solution.
Conclusion
LNG markets are complex. Each project is unique and presents its own challenges. The future of Canadian LNG projects depends upon the overall demand and supply in the global LNG market. As the demand for LNG increases in the next decades, the world will be searching for energy security.
The lower liquefaction and shipping costs coupled with the lower cost of the natural gas itself in Western Canada translate into lower prices for Canadian LNG, particularly that destined for Asian markets. Those advantages will help make Canadian LNG very competitive and attractive to markets worldwide.
Alberta
The permanent CO2 storage site at the end of the Alberta Carbon Trunk Line is just getting started
Wells at the Clive carbon capture, utilization and storage project near Red Deer, Alta. Photo courtesy Enhance Energy
From the Canadian Energy Centre
Inside Clive, a model for reducing emissions while adding value in Alberta
It’s a bright spring day on a stretch of rolling farmland just northeast of Red Deer. It’s quiet, but for the wind rushing through the grass and the soft crunch of gravel underfoot.
The unassuming wellheads spaced widely across the landscape give little hint of the significance of what is happening underground.
In just five years, this site has locked away more than 6.5 million tonnes of CO₂ — equivalent to the annual emissions of about 1.5 million cars — stored nearly four CN Towers deep beneath the surface.
The CO₂ injection has not only reduced emissions but also breathed life into an oilfield that was heading for abandonment, generating jobs, economic activity and government revenue that would have otherwise been lost.
This is Clive, the endpoint of one of Canada’s largest carbon capture, utilization and storage (CCUS) projects. And it’s just getting started.
Rooted in Alberta’s first oil boom
Clive’s history ties to Alberta’s first oil boom, with the field discovered in 1952 along the same geological trend as the legendary 1947 Leduc No. 1 gusher near Edmonton.
“The Clive field was discovered in the 1950s as really a follow-up to Leduc No. 1. This is, call it, Leduc No. 4,” said Chris Kupchenko, president of Enhance Energy, which now operates the Clive field.
Over the last 70 years Clive has produced about 70 million barrels of the site’s 130 million barrels of original oil in place, leaving enough energy behind to fuel six million gasoline-powered vehicles for one year.
“By the late 1990s and early 2000s, production had gone almost to zero,” said Candice Paton, Enhance’s vice-president of corporate affairs.
“There was resource left in the reservoir, but it would have been uneconomic to recover it.”

Facilities at the Clive project. Photo courtesy Enhance Energy
Gearing up for CO2
Calgary-based Enhance bought Clive in 2013 and kept it running despite high operating costs because of a major CO2 opportunity the company was developing on the horizon.
In 2008, Enhance and North West Redwater Partnership had launched development of the Alberta Carbon Trunk Line (ACTL), one of the world’s largest CO2 transportation systems.
Wolf Midstream joined the project in 2018 as the pipeline’s owner and operator.
Completed in 2020, the groundbreaking $1.2 billion project — supported by the governments of Canada and Alberta — connects carbon captured at industrial sites near Edmonton to the Clive facility.
“With CO2 we’re able to revitalize some of these fields, continue to produce some of the resource that was left behind and permanently store CO2 emissions,” Paton said.

Map of the Alberta Carbon Trunk Line courtesy of Wolf Midstream
An oversized pipeline on purpose
Each year, about 1.6 million tonnes of CO2 captured at the NWR Sturgeon Refinery and Nutrien Redwater fertilizer facility near Fort Saskatchewan travels down the trunk line to Clive.
In a unique twist, that is only about 10 per cent of the pipeline’s available space. The project partners intentionally built it with room to grow.
“We have a lot of excess capacity. The vision behind the pipe was, let’s remove barriers for the future,” Kupchenko said.
The Alberta government-supported goal was to expand CCS in the province, said James Fann, CEO of the Regina-based International CCS Knowledge Centre.
“They did it on purpose. The size of the infrastructure project creates the opportunity for other emitters to build capture projects along the way,” he said.

CO2 captured at the Sturgeon Refinery near Edmonton is transported by the Alberta Carbon Trunk Line to the Clive project. Photo courtesy North West Redwater Partnership
Extending the value of aging assets
Building more CCUS projects like Clive that incorporate enhanced oil recovery (EOR) is a model for extending the economic value of aging oil and gas fields in Alberta, Kupchenko said.
“EOR can be thought of as redeveloping real estate,” he said.
“Take an inner-city lot with a 700-square-foot house on it. The bad thing is there’s a 100-year-old house that has to be torn down. But the great thing is there’s a road to it. There’s power to it, there’s a sewer connection, there’s water, there’s all the things.
“That’s what this is. We’re redeveloping a field that was discovered 70 years ago and has at least 30 more years of life.”
The 180 existing wellbores are also all assets, Kupchenko said.
“They may not all be producing oil or injecting CO2, but every one of them is used. They are our eyes into the reservoir.”

CO2 injection well at the Clive carbon capture, utilization and storage project. Photo for the Canadian Energy Centre
Alberta’s ‘beautiful’ CCUS geology
The existing wells are an important part of measurement, monitoring and verification (MMV) at Clive.
The Alberta Energy Regulator requires CCUS projects to implement a comprehensive MMV program to assess storage performance and demonstrate the long-term safety and security of CO₂.
Katherine Romanak, a subsurface CCUS specialist at the University of Texas at Austin, said that her nearly 20 years of global research indicate the process is safe.
“There’s never been a leak of CO2 from a storage site,” she said.
Alberta’s geology is particularly suitable for CCUS, with permanent storage potential estimated at more than 100 billion tonnes.
“The geology is beautiful,” Romanak said.
“It’s the thickest reservoir rocks you’ve ever seen. It’s really good injectivity, porosity and permeability, and the confining layers are crazy thick.”

Suitability of global regions for CO2 storage. Courtesy Global CCS Institute
CO2-EOR gaining prominence
The extra capacity on the ACTL pipeline offers a key opportunity to capitalize on storage potential while addressing aging oil and gas fields, according to the Alberta government’s Mature Asset Strategy, released earlier this year.
The report says expanding CCUS to EOR could attract investment, cut emissions and encourage producers to reinvest in existing properties — instead of abandoning them.
However, this opportunity is limited by federal policy.
Ottawa’s CCUS Investment Tax Credit, which became available in June 2024, does not apply to EOR projects.
“Often people will equate EOR with a project that doesn’t store CO2 permanently,” Kupchenko said.
“We like to always make sure that people understand that every ton of CO2 that enters this project is permanently sequestered. And we take great effort into storing that CO2.”
The International Energy Forum — representing energy ministers from nearly 70 countries including Canada, the U.S., China, India, Norway, and Saudi Arabia — says CO₂-based EOR is gaining prominence as a carbon sequestration tool.
The technology can “transform a traditional oil recovery method into a key pillar of energy security and climate strategy,” according to a June 2025 IEF report.

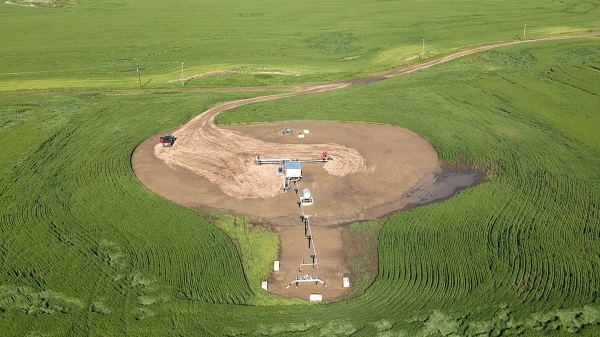
Drone view of the Clive project. Photo courtesy Enhance Energy
Tapping into more opportunity
In Central Alberta, Enhance Energy is advancing a new permanent CO2 storage project called Origins that is designed to revitalize additional aging oil and gas fields while reducing emissions, using the ACTL pipeline.
“Origins is a hub that’s going to enable larger scale EOR development,” Kupchenko said.
“There’s at least 10 times more oil in place in this area.”
Meanwhile, Wolf Midstream is extending the pipeline further into the Edmonton region to transport more CO2 captured from additional industrial facilities.
Canadian Energy Centre
Cross-Canada economic benefits of the proposed Northern Gateway Pipeline project
From the Canadian Energy Centre
Billions in government revenue and thousands of jobs across provinces
Announced in 2006, the Northern Gateway project would have built twin pipelines between Bruderheim, Alta. and a marine terminal at Kitimat, B.C.
One pipeline would export 525,000 barrels per day of heavy oil from Alberta to tidewater markets. The other would import 193,000 barrels per day of condensate to Alberta to dilute heavy oil for pipeline transportation.
The project would have generated significant economic benefits across Canada.

The following projections are drawn from the report Public Interest Benefits of the Northern Gateway Project (Wright Mansell Research Ltd., July 2012), which was submitted as reply evidence during the regulatory process.
Financial figures have been adjusted to 2025 dollars using the Bank of Canada’s Inflation Calculator, with $1.00 in 2012 equivalent to $1.34 in 2025.
Total Government Revenue by Region
Between 2019 and 2048, a period encompassing both construction and operations, the Northern Gateway project was projected to generate the following total government revenues by region (direct, indirect and induced):

British Columbia
- Provincial government revenue: $11.5 billion
- Federal government revenue: $8.9 billion
- Total: $20.4 billion
Alberta
- Provincial government revenue: $49.4 billion
- Federal government revenue: $41.5 billion
- Total: $90.9 billion
Ontario
- Provincial government revenue: $1.7 billion
- Federal government revenue: $2.7 billion
- Total: $4.4 billion
Quebec
- Provincial government revenue: $746 million
- Federal government revenue: $541 million
- Total: $1.29 billion
Saskatchewan
- Provincial government revenue: $6.9 billion
- Federal government revenue: $4.4 billion
- Total: $11.3 billion
Other
- Provincial government revenue: $1.9 billion
- Federal government revenue: $1.4 billion
- Total: $3.3 billion
Canada
- Provincial government revenue: $72.1 billion
- Federal government revenue: $59.4 billion
- Total: $131.7 billion
Annual Government Revenue by Region
Over the period 2019 and 2048, the Northern Gateway project was projected to generate the following annual government revenues by region (direct, indirect and induced):

British Columbia
- Provincial government revenue: $340 million
- Federal government revenue: $261 million
- Total: $601 million per year
Alberta
- Provincial government revenue: $1.5 billion
- Federal government revenue: $1.2 billion
- Total: $2.7 billion per year
Ontario
- Provincial government revenue: $51 million
- Federal government revenue: $79 million
- Total: $130 million per year
Quebec
- Provincial government revenue: $21 million
- Federal government revenue: $16 million
- Total: $37 million per year
Saskatchewan
- Provincial government revenue: $204 million
- Federal government revenue: $129 million
- Total: $333 million per year
Other
- Provincial government revenue: $58 million
- Federal government revenue: $40 million
- Total: $98 million per year
Canada
- Provincial government revenue: $2.1 billion
- Federal government revenue: $1.7 billion
- Total: $3.8 billion per year
Employment by Region
Over the period 2019 to 2048, the Northern Gateway Pipeline was projected to generate the following direct, indirect and induced full-time equivalent (FTE) jobs by region:

British Columbia
- Annual average: 7,736
- Total over the period: 224,344
Alberta
- Annual average: 11,798
- Total over the period: 342,142
Ontario
- Annual average: 3,061
- Total over the period: 88,769
Quebec
- Annual average: 1,003
- Total over the period: 29,087
Saskatchewan
- Annual average: 2,127
- Total over the period: 61,683
Other
- Annual average: 953
- Total over the period: 27,637
Canada
- Annual average: 26,678
- Total over the period: 773,662


What Connor Should Say To Oilers: It’s Not You. It’s Me.
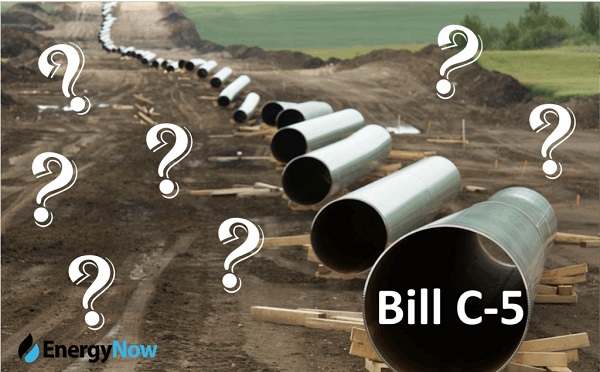
The Passage of Bill C-5 Leaves the Conventional Energy Sector With as Many Questions as Answers

Federal fiscal anchor gives appearance of prudence, fails to back it up

Canada should already be an economic superpower. Why is Canada not doing better?
-
Bruce Dowbiggin1 day ago
What Connor Should Say To Oilers: It’s Not You. It’s Me.
-
Business1 day ago
The Passage of Bill C-5 Leaves the Conventional Energy Sector With as Many Questions as Answers
-
Business1 day ago
Federal fiscal anchor gives appearance of prudence, fails to back it up
-
Business1 day ago
Canada should already be an economic superpower. Why is Canada not doing better?
-
 Alberta1 day ago
Alberta poll shows strong resistance to pornographic material in school libraries
-
 Crime1 day ago
Florida rescues 60 missing kids in nation’s largest-ever operation
-
 Banks1 day ago
Scrapping net-zero commitments step in right direction for Canadian Pension Plan
-
 Business11 hours ago
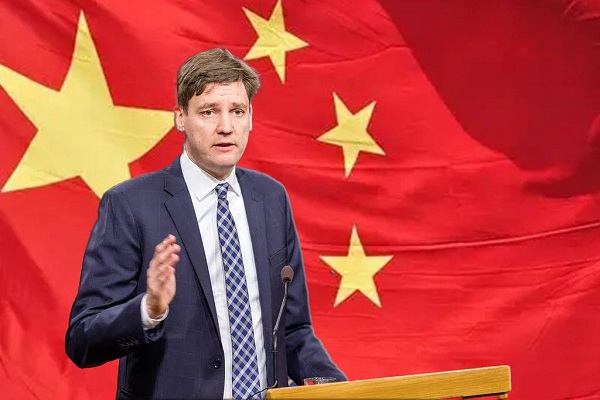
While China Hacks Canada, B.C. Sends Them a Billion-Dollar Ship Building Contract