Economy
What’s behind the explosive growth in Canadian university costs?


From the Macdonald Laurier Institute
By David Clinton for Inside Policy

Dramatic increases in high-end employment costs have been a significant driver of rising university costs.
We’ve probably all seen reports describing out-of-control higher education costs in the United States. An education that in the 1970s could be financed with some savings and a part-time job at the local Burger King will now cost you the equivalent of a down payment on a multi-family investment property.
Those increases are not just the result of regular inflation. When you track US college costs against consumer goods (as the economist Mark J. Perry did), you’ll see that, besides healthcare, rising college-related expenses are unlike anything else.
What changed? The word on the street is that those crazy tuition costs are mostly due to colleges hiring vast armies of non-teaching administrators.
But what about Canadian universities? Back in 2006–07, according to Statistics Canada, across all Canadian universities the average inflation-adjusted cost of one year’s undergraduate tuition was $17,363. Fast forward to 2023–24 – and that same tuition-only cost has now doubled to $34,628.
Note how I referred to those numbers as “costs.” That’s because $34,628 is what you’ll pay if you’re an international student without scholarships. Thanks to government subsidies, Canadians get a big discount. In fact, the average domestic student currently pays only $6,434. But it’s taxpayers who cover the difference.
So, tuition is rising far faster than inflation. But figuring out what’s behind those increases will take some work.
The rise of the university administrator
As the chart shows, since 2001, teaching jobs have dropped from accounting for 17.38 percent of all university positions down to 14.52 percent in 2022. In other words, universities are, proportionally, hiring teaching staff at significantly lower rates than they used to. But please do keep that “proportional” bit in the back of your mind, as we’ll come back to it later.

Source: Statistics Canada/The Audit
However, those numbers don’t tell us who universities are hiring instead of teaching staff. Perhaps they’re building up their food services, security, and custodial crews?
There is at least one identifiable subgroup that’s visibly ballooned: education support services. That North American Industry Classification System category (NAICS Code 6117) includes educational consultants, student exchange program coordinators, testing services, research and development, guidance counsellors, and tutoring and exam preparation services.
Since 2001, the proportion of support services staff in relation to all hires has more than doubled, from 1.06 percent to 2.62 percent. Their absolute numbers across Canada rose from 3,829 to 15,292. (Statistics Canada offers plenty of data and insights on the topics raised in this article. For further investigation, go here, here, and here).
That’s certainly an interesting trend. But an increase of just 1.5 percent isn’t enough to explain the tuition growth we’ve experienced. And I’m also not sure that the “education support services” category maps directly to the class of high-earning administrator they’re talking about in the US. It looks like we could use some more data.
Tracking Salary Changes in Ontario Universities
The year 1996 saw a welcome victory for government transparency when Ontario’s then-Progressive Conservative Premier Mike Harris mandated the annual disclosure of all public sector employees earning more than $100,000. Since that year, the Sunshine List, as it’s popularly known, has grown from just 4,500 names to more than 300,000. However, $100,000 won’t buy you what it once did – especially if you must live in Toronto.
Perhaps we could bring those numbers up to date. Using the Bank of Canada’s inflation calculator, I identified the inflation-adjusted value of 100,000 1996 dollars for 2003 and for 2023. I then identified the individuals on the list who were employed by universities in 2003 and in 2023 and whose salaries were above the inflation-adjusted thresholds. The new thresholds, by the way, were $117,000 for 2003 and $175,000 in 2023.
The first thing that hits you when you see the adjusted data is the explosive growth in hiring. Ontario universities (not including colleges) employed 2,191 individuals earning more than $117,000 in 2003. Twenty years later, the number of employees earning more than $175,000 had ballooned to 8,536. That’s 290 percent growth. The number of people with “dean” in their job description climbed from 195 to 488 during those years. And there are now 6,772 professors on the high earners’ list as opposed to just 1,782 back in 2003.
For context, Statistics Canada tells us that there were 397,776 students enrolled in Ontario universities in 2003 and 579,057 in 2022 (the latest year for which data is available). That’s an increase of 46 percent – which doesn’t justify the 60 percent jump we’ve seen in high-paid deans and the 74 percent increase in similarly high-paid professors.
I think things are starting to come into focus.
Now let’s find out what happened to salaries. Did you know that there’s a strategic management professor who’s earning more than $650,000 annually? And what about that hybrid dean/lecturer who’s pulling in close to $600,000?
Okay… those are probably outliers, and there isn’t much we can learn from them. However, I can tell you that the average university employee in our Sunshine List earned $140,660 back in 2003. Twenty years later, the inflation-adjusted equivalent of that salary would be $211,887. But in the real world – the one that those on the public payroll graciously agree to share with us – the average 2023 university employee on the list earned $220,404. That’s a difference of only 4 percent or so, but that’s after we already accounted for inflation.
Perhaps I can illustrate this another way. The sum of all university salaries above the $117,000 threshold in 2003 was around $308 million. In 2023 dollars, that would equal $464 million. But the actual sum of all 2023 salaries above $175,000 was $1.8 billion (with a “B”)!
So, yes, tuition has doubled since 2006–07. And it seems that dramatic increases in high-end employment costs have been a significant driver. As the taxpayers paying for most of this, there’s a question that we must ask ourselves: has the epic growth in university employment delivered value to Ontario – and to all Canada – at a scale that justifies those costs? In other words, are the students now graduating from Canadian schools equipped to successfully enter a demanding job market, navigate a fractured political environment, and strengthen weakened communities? Recent scenes from campus protests suggest that might not be the case.
David Clinton is the publisher of The Audit (www.theaudit.ca), a journal of data-driven policy analysis. He is also the author of books on data tools, cloud and Linux administration, and IT security.
Business
Climate Climbdown: Sacrificing the Canadian Economy for Net-Zero Goals Others Are Abandoning
By Gwyn Morgan
Canada has spent the past decade pursuing climate policies that promised environmental transformation but delivered economic decline. Ottawa’s fixation on net-zero targets – first under Justin Trudeau and now under Prime Minister Mark Carney – has meant staggering public expenditures, resource project cancellations and rising energy costs, all while failing to
reduce the country’s dependence on fossil fuels. Now, as key international actors reassess the net-zero doctrine, Canada stands increasingly alone in imposing heavy burdens for negligible gains.
The Trudeau government launched its agenda in 2015 by signing the Paris Climate Agreement aimed at limiting the forecast increase in global average temperature to 1.5°C by the end of the century. It followed the next year with the Pan-Canadian Framework on Clean Growth and Climate Change that imposed more than 50 measures on the economy, key among them a
carbon “pricing” regime – Liberal-speak for taxes on every Canadian citizen and industry. Then came the 2030 Emissions Reduction Plan, committing Canada to cut greenhouse gas emissions to 40 percent below 2005 levels by 2030, and to achieve net-zero by 2050. And then the “On-Farm Climate Action Fund,” the “Green and Inclusive Community Buildings Program” and the “Green Municipal Fund.”
It’s a staggering list of nation-impoverishing subsidies, taxes and restrictions, made worse by regulatory measures that hammered the energy industry. The Trudeau government cancelled the fully-permitted Northern Gateway pipeline, killing more than $1 billion in private investment and stranding hundreds of billions of dollars’ worth of crude oil in the ground. The
Energy East project collapsed after Ottawa declined to challenge Quebec’s political obstruction, cutting off a route that could have supplied Atlantic refineries and European markets. Natural gas developers fared no better: 11 of 12 proposed liquefied natural gas export terminals were abandoned amid federal regulatory delays and policy uncertainty. Only a single LNG project in Kitimat, B.C., survived.
None of this has had the desired effect. Between Trudeau’s election in 2015 and 2023, fossil fuels’ share of Canada’s energy supply actually increased from 75 to 77 percent. As for saving the world, or even making some contribution towards doing so, Canada contributes just 1.5 percent of global GHG emissions. If our emissions went to zero tomorrow, the emissions
growth from China and India would make that up in just a few weeks.
And this green fixation has been massively expensive. Two newly released studies by the Fraser Institute found that Ottawa and the four biggest provinces have either spent or foregone a mind-numbing $158 billion to create just 68,000 “clean” jobs – an eye-watering cost of over $2.3 million per job “created”. At that, the green economy’s share of GDP crept up only 0.3
percentage points.
The rest of the world is waking up to this folly. A decade after the Paris Agreement, over 81 percent of the world’s energy still comes from fossil fuels. Environmental statistician and author Bjorn Lomborg points out that achieving global net-zero by 2050 would require removing the equivalent of the combined emissions of China and the United States in each of the next five
years. “This puts us in the realm of science fiction,” he wrote recently.
In July, the U.S. Department of Energy released a major assessment assembled by a team of highly credible climate scientists which asserted that “CO 2 -induced warming appears to be less damaging economically than commonly believed,” and that aggressive mitigation policies might be “more detrimental than beneficial.” The report found no evidence of rising frequency or severity of hurricanes, floods, droughts or tornadoes in U.S. historical data, while noting that U.S. emissions reductions would have “undetectably small impacts” on global temperatures in any case.
U.S. Energy Secretary Chris Wright welcomed the findings, noting that improving living standards depends on reliable, affordable energy. The same day, the Environmental Protection Agency proposed rescinding the 2009 “endangerment finding” that had designated CO₂ and other GHGs as “pollutants.” It had led to sweeping restrictions on oil and gas development and fuelled policies that the current administration estimates cost the U.S. economy at least US$1 trillion in lost growth.
Even long-time climate alarmists are backtracking. Ted Nordhaus, a prominent American critic, recently acknowledged that the dire global warming scenarios used by the Intergovernmental Panel on Climate Change rely on implausible combinations of rapid population growth, strong economic expansion and stagnant technology. Economic growth typically reduces population increases and accelerates technological improvement, he pointed out, meaning emissions trends will likely be lower than predicted. Even Bill Gates has tempered his outlook, writing that climate change will not be “cataclysmic,” and that although it will hurt the poor, “it will not be the only or even the biggest threat to their lives and welfare.” Poverty and disease pose far greater threats and resources, he wrote, should be focused where they can do the most good now.
Yet Ottawa remains unmoved. Prime Minister Carney’s latest budget raises industrial carbon taxes to as much as $170 per tonne by 2030, increasing the competitive disadvantage of Canadian industries in a time of weak productivity and declining investment. These taxes will not measurably alter global emissions, but they will deepen Canada’s economic malaise and
push production – and emissions – toward jurisdictions with more lax standards. As others retreat from net-zero delusions, Canada moves further offside global energy policy trends – extending our country’s sad decline.
The original, full-length version of this article was recently published in C2C Journal.
Gwyn Morgan is a retired business leader who has been a director of five global corporations.

From the Fraser Institute
By Tegan Hill and Elmira Aliakbari
On the campaign trail and after he became prime minister, Mark Carney has repeatedly promised to make Canada an “energy superpower.” But, as evidenced by its first budget, the Carney government has simply reaffirmed the failed plans of the past decade and embraced the damaging energy policies of the Trudeau government.
First, consider the Trudeau government’s policy legacy. There’s Bill C-69 (the “no pipelines act”), the new electricity regulations (which aim to phase out natural gas as a power source starting this year), Bill C-48 (which bans large oil tankers off British Columbia’s northern coast and limit Canadian exports to international markets), the cap on emissions only from the oil and gas sector (even though greenhouse gas emissions have the same effect on the environment regardless of the source), stricter regulations for methane emissions (again, impacting the oil and gas sector), and numerous “net-zero” policies.
According to a recent analysis, fully implementing these measures under Trudeau government’s emissions reduction plan would result in 164,000 job losses and shrink Canada’s economic output by 6.2 per cent by the end of the decade compared to a scenario where we don’t have these policies in effect. For Canadian workers, this will mean losing $6,700 (annually, on average) by 2030.
Unfortunately, the Carney government’s budget offers no retreat from these damaging policies. While Carney scrapped the consumer carbon tax, he plans to “strengthen” the carbon tax on industrial emitters and the cost will be passed along to everyday Canadians—so the carbon tax will still cost you, it just won’t be visible.
There’s also been a lot of buzz over the possible removal of the oil and gas emissions cap. But to be clear, the budget reads: “Effective carbon markets, enhanced oil and gas methane regulations, and the deployment at scale of technologies such as carbon capture and storage would create the circumstances whereby the oil and gas emissions cap would no longer be required as it would have marginal value in reducing emissions.” Put simply, the cap remains in place, and based on the budget, the government has no real plans to remove it.
Again, the cap singles out one source (the oil and gas sector) of carbon emissions, even when reducing emissions in other sectors may come at a lower cost. For example, suppose it costs $100 to reduce a tonne of emissions from the oil and gas sector, but in another sector, it costs only $25 a tonne. Why force emissions reductions in a single sector that may come at a higher cost? An emission is an emission regardless of were it comes from. Moreover, like all these policies, the cap will likely shrink the Canadian economy. According to a 2024 Deloitte study, from 2030 to 2040, the cap will shrink the Canadian economy (measured by inflation-adjusted GDP) by $280 billion, and result in lower wages, job losses and a decline in tax revenue.
At the same time, the Carney government plans to continue to throw money at a range of “green” spending and tax initiatives. But since 2014, the combined spending and forgone revenue (due to tax credits, etc.) by Ottawa and provincial governments in Ontario, Quebec, British Columbia and Alberta totals at least $158 billion to promote the so-called “green economy.” Yet despite this massive spending, the green sector’s contribution to Canada’s economy has barely changed, from 3.1 per cent of Canada’s economic output in 2014 to 3.6 per cent in 2023.
In his first budget, Prime Minister Carney largely stuck to the Trudeau government playbook on energy and climate policy. Ottawa will continue to funnel taxpayer dollars to the “green economy” while restricting the oil and gas sector and hamstringing Canada’s economic potential. So much for becoming an energy superpower.


Richmond Mayor Warns Property Owners That The Cowichan Case Puts Their Titles At Risk

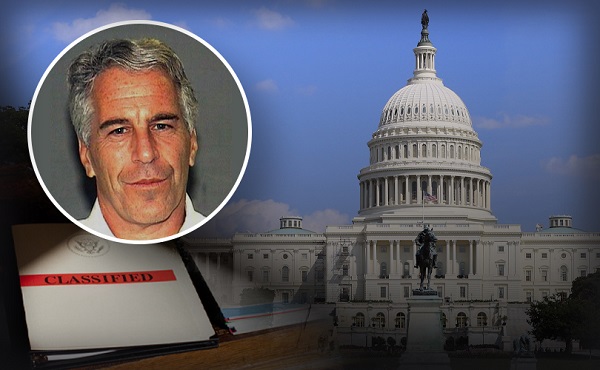
Bondi and Patel deliver explosive “Clinton Corruption Files” to Congress
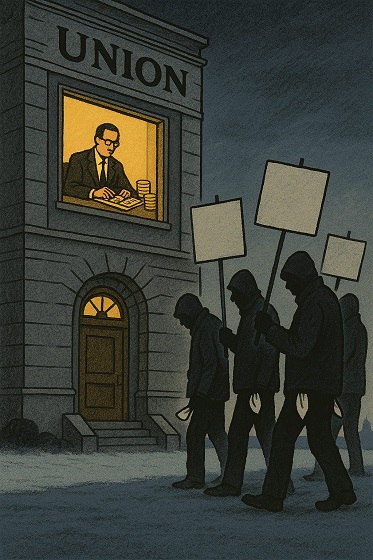
ATA Collect $72 Million in Dues But Couldn’t Pay Striking Teachers a Dime

Sluggish homebuilding will have far-reaching effects on Canada’s economy

Maintenance Mania: Since When Did Pro Athletes Get So Fragile?

Parliamentary Budget Officer begs Carney to cut back on spending

For the sake of Confederation, will we be open-minded about pipelines?
-
 Alberta1 day ago
Calgary mayor should retain ‘blanket rezoning’ for sake of Calgarian families
-
 Bruce Dowbiggin1 day ago
Sports 50/50 Draws: Make Sure You Read The Small Print
-
 espionage1 day ago
Trump says release the Epstein files
-
 Alberta1 day ago
Alberta Offers Enormous Advantages for AI Data Centres
-
 COVID-191 day ago
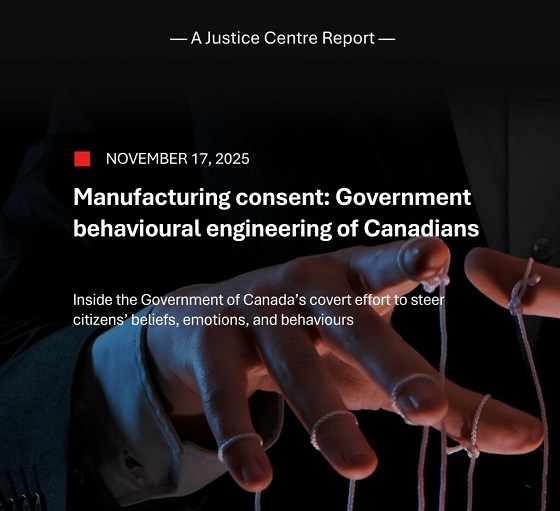
New report warns Ottawa’s ‘nudge’ unit erodes democracy and public trust
-
 Censorship Industrial Complex1 day ago
Quebec City faces lawsuit after cancelling Christian event over “controversial” artist
-
 Alberta1 day ago
National Crisis Approaching Due To The Carney Government’s Centrally Planned Green Economy
-
 Daily Caller18 hours ago
‘Holy Sh*t!’: Podcaster Aghast As Charlie Kirk’s Security Leader Reads Texts He Allegedly Sent University Police