Growth in the number of medically assisted deaths in Canada continues in 2022.
In 2022, there were 13,241 MAID provisions reported in Canada, accounting for 4.1% of all deaths in Canada.
The number of cases of MAID in 2022 represents a growth rate of 31.2% over 2021. All provinces except Manitoba and the Yukon continue to experience a steady year-over-year growth in 2022.
When all data sources are considered, the total number of medically assisted deaths reported in Canada since the introduction of federal MAID legislation in 2016 is 44,958.
Profile of MAID recipients
In 2022, a slightly larger proportion of males (51.4%) than females (48.6%) received MAID. This result is consistent with 2021 (52.3% males and 47.7% females), 2020 (51.9% males and 48.1% females) and 2019 (50.9% males and 49.1% females).
The average age of individuals at the time MAID was provided in 2022 was 77.0 years. This average age is slightly higher than the averages of 2019 (75.2), 2020 (75.3) and 2021 (76.3). The average age of females during 2022 was 77.9, compared to males at 76.1.
Cancer (63.0%) is the most cited underlying medical condition among MAID provisions in 2022, down from 65.6% in 2021 and from a high of 69.1% in 2020. This is followed by cardiovascular conditions (18.8%), other conditions (14.9%), respiratory conditions (13.2%) and neurological conditions (12.6%).
In 2022, 3.5% of the total number of MAID provisions (463 individuals), were individuals whose natural deaths were not reasonably foreseeable. This is an increase from 2.2% in 2021 (223 individuals). The most cited underlying medical condition for this population was neurological (50.0%), followed by other conditions (37.1%), and multiple comorbidities (23.5%), which is similar to 2021 results. The average age of individuals receiving MAID whose natural death was not reasonably foreseeable was 73.1 years, slightly higher than 70.1 in 2021 but lower than the average age of 77.0 for all MAID recipients in 2022.
Nature of suffering among MAID recipients
In 2022, the most commonly cited sources of suffering by individuals requesting MAID were the loss of ability to engage in meaningful activities (86.3%), followed by loss of ability to perform activities of daily living (81.9%) and inadequate control of pain, or concern about controlling pain (59.2%).
These results continue to mirror very similar trends seen in the previous three years (2019 to 2021), indicating that the nature of suffering that leads a person to request MAID has remained consistent over the past four years.
Eligibility Criteria
Request MAID voluntarily
18 years of age or older
Capacity to make health care decisions
Must provide informed consent
Eligible for publicly funded health care services in Canada
Diagnosed with a “grievous and irremediable medical condition,” where a person must meet all of the following criteria:
serious and incurable illness, disease or disability
advanced state of irreversible decline in capability,
experiencing enduring physical or psychological suffering that is caused by their illness, disease or disability or by the advanced state of decline in capability, that is intolerable to them and that cannot be relieved under conditions that they consider acceptable
Mental Illness as sole underlying medical condition is excluded until March 17, 2024
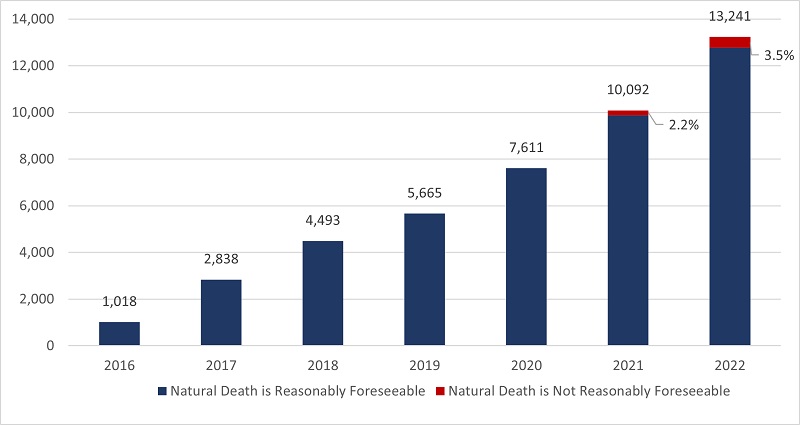
3.1 Number of Reported MAID Deaths in Canada (2016 to 2022)
2022 marks six and a half years of access to MAID in Canada. In 2022, there were 13,241 MAID provisions in Canada, bringing the total number of medically assisted deaths in Canada since 2016 to 44,958. In 2022, the total number of MAID provisions increased by 31.2% (2022 over 2021) compared to 32.6% (2021 over 2020). The annual growth rate in MAID provisions has been steady over the past six years, with an average growth rate of 31.1% from 2019 to 2022.
Chart 3.1: Total MAID Deaths in Canada, 2016 to 2022
Access to MAID for individuals whose deaths were not reasonably foreseeable marked its second year of eligibility in 2022. In Canada, eligibility for individuals whose death is not reasonably foreseeable began on March 17, 2021, after the passage of the new legislation.Footnote8 There were 463 MAID provisions for persons whose natural death was not reasonably foreseeable, representing 3.5% of all MAID deaths in 2022. This is just over twice the total number of provisions for individuals where natural death was not reasonably foreseeable in 2021 (223 provisions representing 2.2% of all MAID provisions in 2021). Table 3.1 represents total MAID provisions in Canada from 2016 to 2022, including provisions for individuals where natural death was not reasonably foreseeable.
All jurisdictions, except Manitoba and Yukon, experienced growth in MAID provisions in 2022. The highest percentage year over year increases occurred in Québec (45.5%), Alberta (40.7%), Newfoundland and Labrador (38.5%), Ontario (26.8%) and British Columbia (23.9%). Nova Scotia (11.8%), Prince Edward Island (7.3%) and Saskatchewan (4.0%) had lower growth rates. The Yukon remained at the same level as 2021, while Manitoba was the only jurisdiction to experience a decline in MAID provisions for 2022 (-9.0%).
Table 3.1: Total MAID Deaths in Canada by Jurisdiction, 2016 – 2022
MAID
NL
PE
NS
NB
QC
ON
MB
SK
AB
BC
YT
NT
NU
Canada
2016
–
–
24
9
494
191
24
11
63
194
–
–
–
1,018
2017
–
–
62
49
853
839
63
57
205
677
–
–
–
2,838
2018
23
8
126
92
1,249
1,500
138
85
307
951
12
–
–
4,493
2019
20
20
147
141
1,604
1,788
177
97
377
1,280
13
–
–
5,665
2020
49
37
190
160
2,278
2,378
214
160
555
1,572
13
–
–
7,611
2021
65
41
245
205
3,299
3,102
245
247
594
2,030
16
–
–
10,092
2022
90
44
274
247
4,801
3,934
223
257
836
2,515
16
–
–
13,241
TOTAL
2016-2022
267
156
1,068
903
14,578
13,732
1,084
914
2,937
9,219
84
–
–
44,958
3.2 MAID Deaths as a Proportion of Total Deaths in Canada
MAID deaths accounted for 4.1% of all deaths in Canada in 2022, an increase from 3.3% in 2021, 2.5% in 2020 and 2.0% in 2019. In 2022, six jurisdictions continue to experience increases in the number of MAID provisions as a percentage of total deaths, ranging from a low of 1.5% (Newfoundland & Labrador) to a high of 6.6% (Québec). MAID deaths as a percentage of total deaths remained at the same levels as 2021 for Prince Edward Island, Nova Scotia, and Saskatchewan, while Manitoba experienced a decline in MAID deaths as a percentage of all deaths (from 2.1% in 2021 to 1.8% in 2022). As with each of the three previous years (2019 to 2021), Québec and British Columbia experienced the highest percentage of MAID deaths as a proportion of all deaths within their jurisdiction in 2022 (6.6% and 5.5% respectively), continuing to reflect the socio-political dynamics of these two jurisdictions in the context of MAID.
4.5 Profile of Persons Receiving MAID Whose Natural Death is not Reasonably Foreseeable
2022 marks the second year that MAID for persons whose natural death is not reasonably foreseeable is permitted under the law if all other eligibility criteria are met (Table 1.1). New federal MAID legislation passed on March 17, 2021, created a two-track approach to procedural safeguards for MAID practitioners to follow, based on whether or not a person’s natural death is reasonably foreseeable. This approach to safeguards ensures that sufficient time and expertise are spent assessing MAID requests from persons whose natural death is not reasonably foreseeable. New and enhanced safeguards (Table 1.2), including a minimum 90-day assessment period, seek to address the diverse source of suffering and vulnerability that could potentially lead a person who is not nearing death to ask for MAID and to identify alternatives to MAID that could reduce suffering.
In 2022, 3.5% of MAID recipients (463 individuals) were assessed as not having a reasonably foreseeable natural death, up slightly from 2.2% (223 individuals) in 2021. As a percentage of all MAID deaths in Canada, MAID for individuals whose natural death is not reasonably foreseeable represents just 0.14% of all deaths in Canada in 2022 (compared to all MAID provisions, which represent 4.1% of all 2022 deaths in Canada). The proportion of MAID recipients whose natural death was not reasonably foreseeable continues to remain very small compared to the total number of MAID recipients.
This population of individuals whose natural death was not reasonably foreseeable have a different medical profile than individuals whose death was reasonably foreseeable. As shown in Chart 4.5A, the main underlying medical condition reported in the population whose natural death was not reasonably foreseeable was neurological (50.0%), followed by ‘other condition’ (37.1%), and multiple comorbidities (23.5%). This differs from the main condition (as reported in Chart 4.1A) for all MAID recipients in 2022, where the majority of persons receiving MAID had cancer as a main underlying medical condition (63.0%), followed by cardiovascular conditions (18.8%) and other conditions (14.9%) (such as chronic pain, osteoarthritis, frailty, fibromyalgia, autoimmune conditions). These results are similar to 2021.
Chart 4.5A: Main Condition, MAID, Natural Death Not Reasonably Foreseeable, 2022
Of the MAID provisions for individuals where death was reasonably foreseeable, the majority were individuals ages 71 and older (71.1%) while only 28.9% were between ages 18-70. A similar trend was observed for individuals where natural death was not reasonably foreseeable which also showed a greater percentage of individuals who received MAID being 71 and older (58.5%) and a lower number of MAID provisions for individuals between 18-70 years (41.5%). Overall, however, MAID provisions for individuals whose death is not reasonably foreseeable tended to be in the younger age categories than those where natural death is foreseeable.
Chart 4.5B: MAID by Age: Natural Death Reasonably Foreseeable Vs Not Reasonably Foreseeable, 2022
After 15 years as a TV reporter with Global and CBC and as news director of RDTV in Red Deer, Duane set out on his own 2008 as a visual storyteller. During this period, he became fascinated with a burgeoning online world and how it could better serve local communities. This fascination led to Todayville, launched in 2016.
Canada today exhibits many of the same underlying conditions that drove Sweden’s course correction, yet its ruling elites lack the wisdom and the courage to change course. Those conditions have been building since at least 2015 and have intensified since the 2020-22 COVID policies. Yet Canada remains immobilized by doctrine, woke culture, ideologically captured institutions, and entrenched incentives that reward delay. The contrast is revealing.
1. Sweden’s Immigration, Citizenship, and Multicultural Reforms
Sweden’s reforms are anchored in the political framework established after the September 2022 election, most notably through the Tidö Agreement. Named after Tidö Castle where the four right-of-centre party leaders negotiated, the agreement set out a program to reduce asylum immigration, tighten family reunification, strengthen enforcement and returns, and raise the threshold for acquiring citizenship. The document runs more than 60 pages and contains nearly 200 reform proposals.
The agreement explicitly targets a “paradigm shift” in Swedish asylum policy. Refugee quotas were slashed from 5,000 per year to just 900. Family reunification rights were reduced to the minimum permitted under EU law. The agreement signals that Sweden will no longer be more generous than its international legal obligations require.
Citizenship reform sits at the centre of this shift. A government inquiry released in January 2025 proposed extending the required period of residence from five years to eight. It introduced stricter self-sufficiency expectations and tightened criminal and conduct standards through an “honourable lifestyle” requirement, which extends the waiting period before an applicant who has committed a crime can be admitted as a Swedish citizen. The proposal also expands citizenship testing to include not only Swedish language proficiency and civic knowledge but also additional areas such as the role of media in society and children’s rights. These legislative amendments are proposed to enter into force on 1 June 2026.
Administrative reforms already require in-person identity verification and expanded documentation for citizenship applicants. Proposals are underway to permit revocation of citizenship in cases of fraud, “system-threatening crime,” or serious national security threats. In September 2025, a government commission proposed revoking permanent residence permits previously granted on asylum-related grounds, requiring affected individuals to obtain citizenship, qualify for a temporary permit, or leave the country by 2027.
Since 2022, approximately 40 legislative proposals have been presented in this restrictive direction, covering naturalization, detention, return, deportation, duration of re-entry bans, and incentive structures for voluntary repatriation. The Social Democrats, the largest opposition party and architects of the 2015-16 policy changes, now advocate a similar migration policy. The political consensus has shifted.
Multiculturalism has not been repealed, but it has been demoted. It is no longer a governing ideology but a social reality managed through integration requirements. Swedish policy now stresses adaptation to Swedish norms rather than state accommodation. Citizenship is treated as the culmination of integration, not a shortcut to it.
2. The Conditions That Forced Sweden’s Hand
Sweden did not change course because restraint became fashionable. It pivoted because conditions became operationally intolerable.
The most visible trigger was organized crime. Sweden experienced a sustained rise in gun violence tied to criminal networks, particularly in urban and suburban areas. Gun violence began increasing in the mid-2000s and accelerated sharply from 2013 onward. By 2022, Sweden recorded 391 confirmed shootings and 63 people killed by gunfire, its bloodiest year of gun violence in modern times. The Swedish National Council for Crime Prevention (Brå) reports that Sweden’s gun homicide rate stands at approximately 4 deaths per million inhabitants, compared to a European average of 1.6. In 2023, 53 people were shot dead, the second-highest number ever recorded.
The problem extends beyond shootings. In 2024, police recorded 317 bombings, more than double the number in 2023. Gang-related explosions rose from 149 incidents in 2023 to 317 in 2024. Media estimates suggest that more than 60,000 people may be connected to organized criminal networks. These networks developed the capacity to recruit minors, intimidate witnesses, launder money, and exploit welfare systems. Swedish authorities began describing the phenomenon as “system-threatening crime,” signalling that the problem had moved beyond ordinary policing into a challenge to state authority itself.
Parallel social fragmentation deepened the multicultural strain. Swedish police identified “vulnerable areas” marked by low employment, weak language integration, limited trust in institutions, and the presence of informal authority structures. As of 2024, approximately 65 such areas exist nationwide, housing around 550,000 people, or 5 percent of Sweden’s population. In the most serious “particularly vulnerable areas,” now numbering 19, police report that the situation makes it “difficult or almost impossible” for them to fulfill their mission. Parallel society structures exercise their own form of justice and control. Residents show widespread disinclination to participate in legal processes, and systematic threats and violence target witnesses.
Schools and social services struggled to enforce standards. Emergency services adapted their behaviour by ensuring proper backup, entering areas via alternative routes, or reversing vehicles to enable quick departure if needed. In 2017, police estimated that 40 percent of residents in vulnerable areas had not completed primary education, and less than half of 15-year-olds in Gothenburg’s especially vulnerable areas qualified for secondary education.
Equally important was the collapse of elite credibility. For years, Swedish political and cultural elites insisted that crime and integration failure were unrelated to migration volume or composition. As evidence accumulated, public trust eroded. Immigration policy became inseparable from questions of public order, welfare sustainability, and state capacity.
Haultain Research is a reader-supported publication.
To receive new posts and support our work, consider becoming a free or paid subscriber.
Canada’s deterioration since 2015 has been real, cumulative, and measurable. It is not identical to Sweden’s experience, but the conditions increasingly rhyme with it.
Crime severity in Canada has risen since 2015, as measured by Statistics Canada’s Crime Severity Index. After a temporary decline in 2020 due to the initial lockdowns, crime severity rose again, with three consecutive years of increases through 2023. The Index decreased 4% in 2024, the second decrease in a decade. The pattern is not linear, but the direction since 2015 is unmistakable. Canada has not enjoyed the sustained improvement in public safety that many citizens still assume is the norm. Several categories of violent crime increased in the post-2020 period, including extortion, which rose 35% in 2023 for the fourth consecutive year.
Canada’s organized crime problem is extensive and deeply embedded. Unlike Sweden’s highly visible gang warfare, much of Canada’s organized crime operates through fentanyl production and trafficking, large-scale auto theft rings exporting vehicles overseas, money laundering through real estate and trade-based schemes, and human trafficking and labour exploitation. This criminal economy is less spectacular but more corrosive. It fuels addiction, distorts housing markets, normalizes fraud, and erodes confidence that the rules apply evenly.
The opioid crisis illustrates the scale of this harm. More than 53,000 Canadians have died from apparent opioid toxicity since January 2016. In the first half of 2025, an average of 21 people died each day. These deaths are not abstractions. They exert sustained pressure on policing, emergency medicine, hospitals, and social services, while feeding criminal networks that thrive where enforcement is slow and authority fragmented.
Canada’s social services have simultaneously degraded. Housing supply failed to keep pace with demand well before the COVID event. The Canada Mortgage and Housing Corporation estimates that restoring affordability levels last seen in 2019 will require between 430,000 and 480,000 new housing units per year for the next decade. This represents an approximate doubling of the current pace of home construction. In 2022, CMHC originally estimated Canada needed 3.5 million additional units by 2030 to restore affordability to early-2000s levels; by 2025, the agency had to scale down its target, effectively acknowledging that early-2000s affordability was no longer realistic. Rapid population growth fuelled by migration after 2020 collided with that shortage, producing rising rents, collapsing affordability, and growing homelessness, including among working Canadians.
Healthcare systems face persistent strain. Emergency departments report rising volumes and extended lengths of stay, with staffing shortages exacerbated by draconian vaccination mandates compounding delays. Schools and municipal services struggle with overcrowding, language integration demands, and infrastructure deficits. These pressures are now structural, not temporary.
Immigration acts as a stress multiplier rather than a sole cause. Population growth has outpaced housing, healthcare, transit, and education capacity. Asylum and temporary resident processing inventories have grown substantially in recent years. Integration expectations remain modest relative to the intake scale.
Public trust erodes quietly, but it erodes under the weight of intimidation by ideological and propagandistic smears of racism. Citizens lower their expectations, adjust their behaviour, and accept disorder as background noise. That adaptation is an early signal of institutional retreat.
Despite these conditions, Canada has not adopted reforms comparable to Sweden’s. The paralysis has multiple, reinforcing causes.
Political entrenchment matters. The same federal party governed from 2015 to early 2025, the period during which many deterioration indicators emerged or intensified, including rising crime severity, prolonged housing unaffordability, growing asylum backlogs, and visible strain across social services. Continuity of power blurs accountability. Structural problems are reframed as inherited, masked as global, or treated as administrative rather than as the predictable outcomes of sustained choices.
Electoral incentives deepen inertia. Immigration policy is closely tied to coalition management in major urban centres in Central Canada, where immigrant communities represent important and growing voting blocs. This is not a claim of illegitimate influence, although serious questions about foreign interference remain unresolved. It is at least electoral arithmetic. Policies perceived as restrictive or enforcement-oriented carry political risk in constituencies where immigration is framed as identity affirmation rather than capacity-limited policy. That risk favours symbolism over structural reform. Canada developed a government that governed through symbolic pronouncements rather than solutions.
Narrative lock-in reinforces the problem, fuelled by a press captured by the federal state through direct subsidies. Immigration and multiculturalism have acquired moral status. Evidence of failure is treated as miscommunication rather than misdesign. Housing shortages become funding debates filled by recurrent promises that never materialize. Crime becomes an optics problem. Service strain becomes a funding argument. The possibility that intake exceeds integration capacity is excluded early from acceptable discourse.
Canada’s advocacy and consultative ecosystem further narrows the space for reform. Many organizations operate within frameworks that assume continued high immigration and expansive accommodation. They do not set policy, but they shape the environment in which policy is evaluated. They, too, are clients of the state.
Urban concentration also matters. The benefits of high immigration accrue disproportionately to metropolitan labour markets and asset-owning sectors. Many of the costs fall on municipalities, renters, younger cohorts, and strained service systems with limited fiscal autonomy. This asymmetry reduces urgency. The wealth and generational gap between beneficiaries of the status quo and those bearing its costs is remarkable.
Jurisdictional fragmentation, often exploited as a political tool, compounds paralysis. Immigration is mostly federal in practice, though it is constitutionally shared. Housing, healthcare delivery, policing resources, and social services are largely provincial or municipal. Lower levels of government see their planning and programmes sabotaged by federal policy that operates without regard for downstream consequences. Responsibility diffuses easily. Problems in Ottawa are treated as separate files rather than as interacting consequences.
Finally, time horizons work against reform. The benefits of high intake are immediate: labour supply, headline GDP growth, and short-term fiscal flows. The costs accumulate slowly: degraded services, entrenched criminal economies, weakened trust. Electoral systems reward short-term stability over long-term repair.
5. Anticipating the Objections
Several objections predictably arise whenever Canada’s immigration and integration failures are raised. They deserve direct answers for the conversation to move forward.
Canada is not Sweden. That is true in the narrow sense and beside the point in the larger one. The comparison is not about copying policies but about recognizing patterns. Organized crime exploits weak enforcement wherever it finds it. Housing shortages follow population growth that outpaces supply in any market. Social trust erodes when citizens experience disorder and declining services while being told that concern itself is the problem. Geography does not repeal capacity limits.
Crime and social strain are unrelated to immigration. This objection mistakes interaction for causation. Immigration does not create every problem. It amplifies existing weaknesses when intake exceeds the capacity of integration and enforcement. Sweden learned this when welfare systems and policing were stretched beyond what trust-based governance could sustain. Canada’s experience since 2015 shows the same interaction at work, compounded by misguided movements to defund police.
Economic benefits justify current levels. Immigration does contribute to labour supply and headline GDP. What is disputed is the assumption that aggregate growth equals public benefit. When gains concentrate in asset inflation and low-wage labour supply, while costs are borne through housing unaffordability, service overload, vanishing productivity growth, and weakened enforcement, social consent erodes.
Reform risks intolerance. This contention confuses enforcement with animus. Sweden’s reforms are based on conduct, compliance, and capacity, not ethnicity or belief. Citizenship thresholds, benefit conditions, and removal enforcement apply by rule, not identity. Treating immigration and citizenship as policy instruments rather than moral symbols is governance, not exclusion.
Canada lacks the legal room to act. This overstates constitutional paralysis. The Charter constrains means, not ends. It requires proportionality and fairness, not the passivity we see daily. The COVID period showed what governments can do and how they can circumvent obstacles when they want something done. Canada retains broad authority over intake levels, enforcement priorities, benefit conditions, and citizenship criteria. The authority needs to be exercised.
These problems are temporary shocks. Canada’s crime trends since 2015, its housing supply gap, its opioid death toll, and its enforcement backlogs are cumulative indicators. But ten years of waiting for them to correct themselves is not prudent (That strategy already failed in the fiscal sphere). It is abdication.
These objections do not defeat the necessity for reform. But they explain the paralyzing delay.
Conclusion
Sweden changed course when a critical and courageous mass of citizens concluded that the state could no longer guarantee cohesion under existing policies. Does Canada have the necessary courage and critical mass to push for similar solutions?
Sweden’s reforms were not driven by hostility to newcomers. They were driven by a sober recognition that inclusion without enforcement and generosity without reciprocity corrode the foundations of a liberal state. Sweden concluded that immigration must align with integration capacity, that citizenship must mean something, and that social trust cannot be sustained by slogans alone.
Canada faces the same choice. Since 2015, crime severity has risen, organized criminal economies have embedded themselves more deeply, housing affordability has collapsed, healthcare systems have strained, and institutional trust has weakened. Since 2020, these pressures have intensified. None of this requires panic. It requires honesty and the courage to face reality.
Meaningful reform is not anti-immigrant, as Sweden has demonstrated. It is pro-citizen and pro-integration. A system that enforces its rules, sets clear thresholds, and aligns intake with capacity is fairer to newcomers and to those of us already here. It offers membership rather than ambiguity, and belonging rather than permanent precarity.
Sweden chose boundaries before its institutions failed. Canada theoretically still has that option. But it lacks the courage to act, the willingness to accept limits and the sobriety to tell the truth about trade-offs. There is room for Canada’s long-established immigrants to take the lead in advocating for these reforms, which the timid Laurentian elites aren’t fit to correct. A serious country does not confuse moral posture with policy, or delay correction until ideological dysfunction hardens into a norm.
The question is not whether Canada needs reform. It is whether it will choose reform deliberately, or be forced to adopt worse policies later under even worse conditions.
Haultain Research is a reader-supported publication.
To receive new posts and support our work, consider becoming a free or paid subscriber.
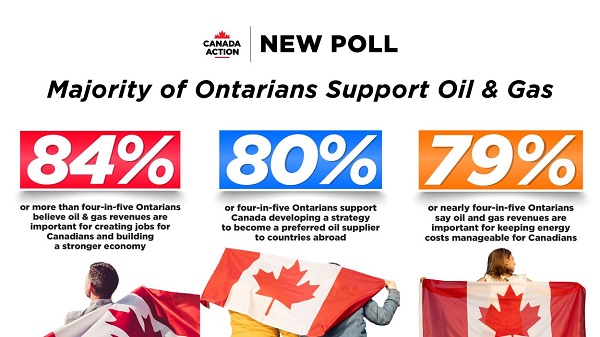
A new Ontario-wide survey conducted by Nanos Research on behalf of Canada Action finds strong public consensus that Canadian oil and gas revenues are critical to jobs, economic growth, and trade – and that Canada should lean into its energy advantage at home and abroad.
“Our polling feedback shows that a majority of Ontarians recognize the vital, irreplaceable role oil and gas has to play in our national economy. Canadians are telling us they want to see more support for the oil and gas sector, which is foundational to our standard of living and economy at large,” said Canada Action spokesperson, Cody Battershill.
The online survey of 1,000 Ontarians shows that more than four in five (84 per cent) respondents believe oil and gas revenues are important for creating jobs for Canadians and building a stronger economy. Additionally, four-in-five (80 per cent) support Canada developing a strategy to become a preferred oil supplier to countries, while Ontarians are more than eight times as likely to support as to oppose Canada supplying oil and gas, provided it remains a major source of energy worldwide.
“Building new trade infrastructure, including pipelines to the coasts that would get our oil and gas resources to international markets, can help Canadians diversify our trading partners, maximize the value of our resources, and secure a strong and prosperous future for our families,” Battershill said.
Also, nearly four-in-five (79 per cent) of Ontarians say oil and gas revenues are important for keeping energy costs manageable for Canadians.
“Our poll is just one of many in Canada since the start of 2025 that show a majority of Canadians are supportive of oil and gas development. It’s time we get moving forward on these projects without delay and learn from the lessons of our past, where we saw multiple pipelines cancelled to the detriment of Canada’s long-term economic success.”
Additional findings include:
Four-in-five (80 per cent) of Ontarians support Canada supplying oil and gas, provided it remains a major source of energy worldwide.
Four-in five (80 per cent) of Ontarians believe oil and gas revenues are important when it comes to building stronger trading partnerships.
Nearly four-in-five (79 per cent) of Ontarians say oil and gas revenues are important for keeping energy costs manageable for Canadians.
Nearly four-in-five (78 per cent) of Ontarians support Canada stepping up to provide our key NATO allies with secure energy sources.
Nearly four-in-five (78 per cent) of Ontarians support Canada increasing oil and gas exports around the world, about six and a half times more likely than to oppose.
Nearly four-in-five (77 per cent) of Ontarians support Canada providing Asia and Europe with oil and gas so that they are less reliant on authoritarian suppliers.
Nearly three-in-four (74 per cent) of Ontarians support Canada increasing oil and gas exports around the world, five times more likely than to oppose.
Nearly three-in-four (74 per cent) of Ontarians say oil and gas revenues are important to reducing taxes for Canadians.
More than seven-in-ten (71 per cent) of Ontarians support building new energy infrastructure projects without reducing environmental protections and safety.
More than six-in-ten (63 per cent) of Canadians say they are important for paying for social programs, including health care, education, and other public services.
Respondents were nine times more likely to say the government approval process for energy infrastructure projects is too slow (46 per cent) rather than too fast (5 per cent).
About the survey
The survey was conducted by Nanos Research for Canada Action using a representative non-probability online panel of 1,000 Ontarians aged 18 and older between December 10 and 12, 2025.
While a margin of error cannot be calculated for non-probability samples, a probability sample of 1,000 respondents would have a margin of error of ±3.1 percentage points, 19 times out of 20.


 of Ontarians believe oil and gas revenues are important for creating jobs for Canadians")