David Clinton
Is Marriage the Strongest Predictor of Wealth in Canada?


Love, they say, is a many-splendored thing. But I can tell you with confidence that, in Canada at least, it also pays handsomely.
Sharp downward trends in fertility rates are pointing to a bleak future. And as we’re discovering, immigration isn’t necessarily going to save us. Working on the reasonable assumption that the high costs of raising kids were holding us back, governments have been working for decades to encourage childbirth through programs like the Canada Child Tax Benefit. Their hearts were in the right place, but the result haven’t been great.
The Audit is a reader-supported publication. To receive new posts and support my work, consider becoming a free or paid subscriber.
The child and family support programs have been significant. For example, the average total of government support transfers in inflation-adjusted dollars paid to single parents have grown from $11,600 in 1976 to $19,400 in 2022. That amounts to around 29 percent of their average total earned income. Benefits for couples with children nearly tripled from a 1976 average of $5,800 to $15,300 by 2022. Those transfers included child benefits, employment insurance benefits, and social assistance.
But it turns out that even without government programs, marriage and parenting are both financially rewarding endeavors. In 2022, According to Statistics Canada, the average individual “not in an economic family” earned just $53,400 from both market (i.e., earned) income and government support. That same year, couples earned $135,600 – an increase of around 51 percent over what they would have earned in 1976. And the average couple with children took $169,900 home. For comparison, single parents earned just $80,100.
Of course it’s possible that couples who happen to be wealthier are more likely consider themselves capable of raising children, so to some extent they’re self-selecting. And some singles feel unable to start families because of crazy housing costs. Nevertheless, it seems that marriage and, to a lesser degree, parenthood are important predictors of higher income.
Are government social support programs behind the imbalance? Not so much. The average couple in 2022 received $7,300 in benefits, but that’s significantly less than the $9,800 that the average singles (without kids) got. In fact, it’s also a lot less than the $10,400 childless couples would have received from the government in 1976.
It’s clearly earned income that’s driving the greater wealth of both couples as a whole and couples with children.
This isn’t a new development. Throughout the half century since 1976 – when you exclude government benefits – couples have out-earned singles by an average of 140 percent. And couples with children have earned an average of 12.5 percent more than couples in general.
The bottom line is that couples – both with and without children – earn significantly more than both single parents and singles living outside of a family unit. This economic reality has persisted through financial crises, evolving government policy standards, and social upheavals.
That knowledge could play a role in young peoples’ thinking as they plan their lives. But it’s also one of many reasons that we, as a society, should aggressively protect the integrity of the family as an institution. All things being equal, families lead to better outcomes.
This idea is something found in no less a source than the United Nation’s Universal Declaration of Human Rights (Article 16):
The family is the natural and fundamental group unit of society and is entitled to protection by society and the State.
There is something a bit strange about all this data that I can’t explain. between 1990 and 2004, the difference between total income of couples with children and total income of single parents was significantly greater than the years either before or since.
Many things happened in the early 90’s that might have triggered the growing disparity (like the introduction of the Canada Child Tax Benefit, increasing access to childcare, or a narrowing gender pay gap), but none of them suddenly stopped in 2004. And one could imagine similar social and policy changes that might have reduced the disparity after 2004 (like increased female workforce participation), but none of them really began in 2005.
 |
That odd differential certainly looks real. But maybe it doesn’t mean anything. Sometimes a cigar is just a cigar. Any thoughts to share?
Subscribe to The Audit. If you already subscribe to the newsletter there’s more.. For the full experience, upgrade your subscription.

Thanks for considering The Audit. It also helps if you Refer a friend


Based mostly on their 2024 budget, the federal government has promised $2.4 billion in support of artificial intelligence (A.I.) innovation and research. Given the potential importance of the A.I. sector and the universal expectation that modern governments should support private business development, this doesn’t sound all that crazy.
But does this particular implementation of that role actually make sense? After all, the global A.I. industry is currently suffering existential convulsions, with hundreds of billions of dollars worth of sector dominance regularly shifting back and forth between the big corporate players. And I’m not sure any major provider has yet built a demonstrably profitable model. Is Canada in a realistic position to compete on this playing field and, if we are, should we really want to?
First of all, it’s worth examining the planned spending itself.
- $2 billion over five years was committed to the Canadian Sovereign A.I. Compute Strategy, which targets public and private infrastructure for increasing A.I. compute capacity, including public supercomputing facilities.
- $200 million has been earmarked for the Regional Artificial Intelligence Initiative (RAII) via Regional Development Agencies intended to boost A.I. startups.
- $100 million to boost productivity is going to the National Research Council Canada’s A.I. Assist Program
- The Canadian A.I. Safety Institute will receive $50 million
In their goals, the $300 million going to those RAII and NRC programs don’t seem substantially different from existing industry support programs like SR&ED. So there’s really nothing much to say about them.
And I wish the poor folk at the Canadian A.I. Safety Institute the best of luck. Their goals might (or might not) be laudable, but I personally don’t see any chance they’ll be successful. Once A.I. models come on line, it’s only a matter of time before users will figure out how to make them do whatever they want.
But I’m really interested in that $2 billion for infrastructure and compute capacity. The first red flag here has to be our access to sufficient power generation.
Canada currently generates more electrical power than we need, but that’s changing fast. To increase capacity to meet government EV mandates, decarbonization goals, and population growth could require doubling our capacity. And that’s before we try to bring A.I. super computers online. Just for context, Amazon, Microsoft, Google, and Oracle all have plans to build their own nuclear reactors to power their data centers. These things require an enormous amount of power.
I’m not sure I see a path to success here. Plowing money into A.I. compute infrastructure while promoting zero emissions policies that’ll ensure your infrastructure can never be powered isn’t smart.
However, the larger problem here may be the current state of the A.I. industry itself. All the frantic scrambling we’re seeing among investors and governments desperate to buy into the current gold rush is mostly focused on the astronomical investment returns that are possible.
There’s nothing wrong with that in principle. But “astronomical investment returns” are also possible by betting on extreme long shots at the race track or shorting equity positions in the Big Five Canadian banks. Not every “possible” investment is appropriate for government policymakers.
Right now the big players (OpenAI, Anthropic, etc.) are struggling to turn a profit. Sure, they regularly manage to build new models that drop the cost of an inference token by ten times. But those new models consume ten or a hundred times more tokens responding to each request. And flat-rate monthly customers regularly increase the volume and complexity of their requests. At this point, there’s apparently no easy way out of this trap.
Since business customers and power users – the most profitable parts of the market – insist on using only the newest and most powerful models while resisting pay-as-you-go contracts, profit margins aren’t scaling. Reportedly, OpenAI is betting on commoditizing its chat services and making its money from advertising. But it’s also working to drive Anthropic and the others out of business by competing head-to-head for the enterprise API business with low prices.
In other words, this is a highly volatile and competitive industry where it’s nearly impossible to visualize what success might even look like with confidence.
Is A.I. potentially world-changing? Yes it is. Could building A.I. compute infrastructure make some investors wildly wealthy? Yes it could. But is it the kind of gamble that’s suitable for public funds?
Perhaps not.

Rising CO2 levels have, in fact, been instrumental in promoting an ongoing planet-wide increase in vegetation cover. This is thanks to enhanced photosynthesis and water use efficiency and has contributed to higher agricultural yields. It turns out that, whatever acidification may be happening, there appears to be no serious impact on marine life.
The Climate Working Group at the U.S. Department of Energy recently published “A Critical Review of Impacts of Greenhouse Gas Emissions on the U.S. Climate“. Of note, that group includes University of Guelph’s very own Professor Ross McKitrick.
The authors conclude that while climate change is real and influenced by human emissions, its risks are often exaggerated. Instead:
- Published models have consistently and aggressively overestimated warming
- Extreme weather trends are not worsening as claimed
- Aggressive mitigation policies may cause more harm than good
Rising CO2 levels have, in fact, been instrumental in promoting an ongoing planet-wide increase in vegetation cover. This is thanks to enhanced photosynthesis and water use efficiency and has contributed to higher agricultural yields. It turns out that, whatever acidification may be happening, there appears to be no serious impact on marine life.
To be sure, there’s been vocal push back against the report’s findings. But that just highlights the complexity, volatility, and intense political stakes of the issues involved.
Despite my own stellar academic publishing history (see my high school paper from 45 years ago on CO2 emissions and the acidification of lakes in Ontario for full details), it turns out that I’m not qualified to express an opinion here. After all, I lack the necessary combined expertise in natural sciences, applied sciences, social sciences, and so on.
But I suspect that the people in Ottawa who make related policy decisions aren’t necessarily all that better prepared than I am. Which makes me wonder just how much of our money has been spent through the past ten years based on assumptions that are far from universally accepted in the scientific community.
The short answer is: many billions of dollars. Here are some highlights:
- $28.7 billion for the public transit envelope from the Investing in Canada Plan
- $26.9 billion for the Green Infrastructure Investments envelope from the Investing in Canada Plan
- $2 billion for the Low Carbon Economy Fund
- $8 billion for the Net Zero Accelerator
- $103 billion for the Clean-economy Investment Tax Credits (although that won’t all be spent before 2035)
- $3 billion in EV purchase rebates from the Incentives for Zero-Emission Vehicles
- $2.6 billion for Canada Greener Homes Grants
- $2.75 billion for the Zero-Emission Transit Fund (school buses and municipal ZEV fleets)
- $1.5 billion to support low-carbon fuel production and adoption
- $964 million for the Smart Renewables and Electrification Pathways Program (renewable projects, storage, and grid modernization)
- $680 million for Zero-Emission Vehicle Infrastructure Program (charging stations and hydrogen refuelling)
Granted, some of that funding will address other policy needs besides just climate change mitigation, and nearly all of it is designed to be paid out over multiple years. And of course, not all funds that were allocated have been spent yet. Two thumbs up for inertia!
But it’s still an awful lot of money considering no one really knows for sure whether any of this is helpful. Not to mention that, while it’s complicated, after a decade of trying, Canada’s actual emissions haven’t necessarily dropped.


Bondi and Patel deliver explosive “Clinton Corruption Files” to Congress

Richmond Mayor Warns Property Owners That The Cowichan Case Puts Their Titles At Risk

Sluggish homebuilding will have far-reaching effects on Canada’s economy

Lack of adequate health care pushing Canadians toward assisted suicide
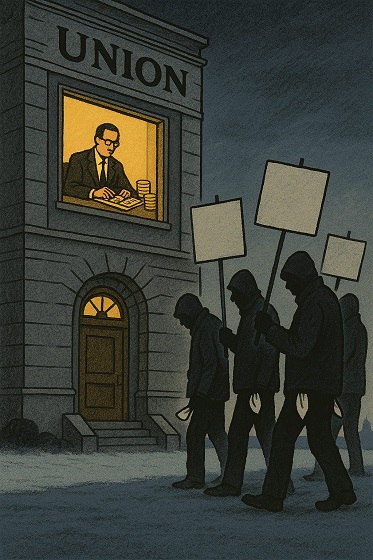
ATA Collect $72 Million in Dues But Couldn’t Pay Striking Teachers a Dime

For the sake of Confederation, will we be open-minded about pipelines?

Carney shrugs off debt problem with more borrowing
-
 Alberta1 day ago
Calgary mayor should retain ‘blanket rezoning’ for sake of Calgarian families
-
 espionage1 day ago
Trump says release the Epstein files
-
 Bruce Dowbiggin1 day ago
Sports 50/50 Draws: Make Sure You Read The Small Print
-
 Alberta1 day ago
Alberta Offers Enormous Advantages for AI Data Centres
-
 COVID-191 day ago
New report warns Ottawa’s ‘nudge’ unit erodes democracy and public trust
-
 Censorship Industrial Complex1 day ago
Quebec City faces lawsuit after cancelling Christian event over “controversial” artist
-
 Alberta1 day ago
National Crisis Approaching Due To The Carney Government’s Centrally Planned Green Economy
-
 Daily Caller14 hours ago
‘Holy Sh*t!’: Podcaster Aghast As Charlie Kirk’s Security Leader Reads Texts He Allegedly Sent University Police