Fraser Institute
Ignore climate-obsessed propagandists and enjoy your summer


From the Fraser Institute

Ah summer, a season we used to meet with joy. Outdoor parties, leisurely road trips, weekends at the beach, blazing barbecues by day, blazing bonfires by night. We used to sing paeans to the season—“Summertime, and the living is easy, fish are jumping and the cotton is high.”
But a strange thing has happened—the climate-obsessed folks have seized upon summer as a primary propaganda source and use it to demonize activities that might produce greenhouse gases. They don’t want your living to be easy. They want your coal or gas barbecues gone, your road trips gone, your air conditioning coolant weakened or gone, and so on. And every heatwave, every forest fire, every hint of drought, every reported case of heatstroke, and even observations of jumping catfish will be proof of a climate crisis where extreme weather will eventually kill us all.
But in a recent study, I found that the evidence of increases in extreme weather events in Canada and around the world is spotty and of limited quality, and often contradictory of the narrative.
First, what about wildfires? The United Nations Intergovernmental Panel on Climate Change (IPCC), in its latest climate report, only assigns “medium confidence” to the idea that climate change has actually caused increased “fire weather” in some regions on Earth.
Here at home, as average atmospheric temperatures have risen from 1970 to 2017, Canadian forest fires have actually declined sharply in number and show little obvious trend in areas burnt. As economist/professor Ross McKitrick observes: “Canadian forest fire data are available from the Wildland Fire Information System. Wildfires have been getting less frequent in Canada over the past 30 years. The annual number of fires grew from 1959 to 1990, peaking in 1989 at just over 12,000 that year, and has been trending down since. From 2017 to 2021 (the most recent interval available), there were about 5,500 fires per year, half the average from 1987 to 1991. The annual area burned also peaked 30 years ago. It grew from 1959 to 1990, peaking in 1989 at 7.6 million hectares before declining to the current average of 2.4 million hectares per year over 2017-21. And 2020 marked the lowest point on record with only 760,000 hectares burned.”
Well, but what about drought? According to an international research team, “In the vast majority of the world, trends in meteorological drought duration and magnitude are not statistically significant, with the exception of some small regions of Africa and South America, which is also where data uncertainty is greater.” The International Energy Agency (IEA) in a 2021 report suggests that drought severity in Canada from 2000 to 2020 was only slightly above the global average.
Well, but what about floods? The IPCC says floods have likely increased globally since 1950, but in Canada, at least, “there is a lack of detectable trends in observed annual maximum daily (or shorter duration) precipitation.”
So, summertime and the living is easy. Ignore the shrieks of the climate-obsessed about extreme weather coming for us all, and have some fun in the sun.
Author:

From the Fraser Institute
By Annika Segelhorst and Elmira Aliakbari
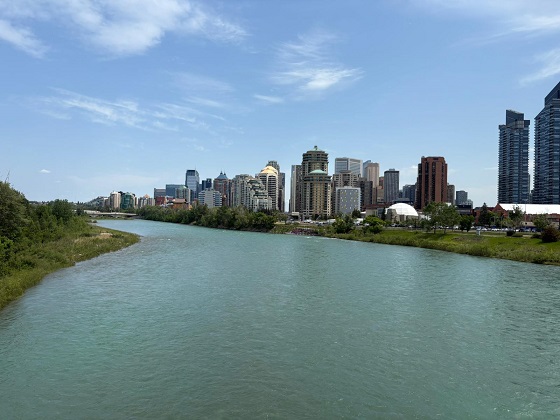
Canada’s rivers are vital to our environment and economy. Clean freshwater is essential to support recreation, agriculture and industry, an to sustain suitable habitat for wildlife. Conversely, degraded freshwater can make it harder to maintain safe drinking water and can harm aquatic life. So, how healthy are Canada’s rivers today?
To answer that question, Environment Canada uses an index of water quality to assess freshwater quality at monitoring stations across the country. In total, scores are available for 165 monitoring stations, jointly maintained by Environment Canada and provincial authorities, from 17 in Newfoundland and Labrador, to 8 in Saskatchewan and 20 in British Columbia.
This index works like a report card for rivers, converting water test results into scores from 0 to 100. Scientists sample river water three or more times per year at fixed locations, testing indicators such as oxygen levels, nutrients and chemical levels. These measurements are then compared against national and provincial guidelines that determine the ability of a waterway to support aquatic life.
Scores are calculated based on three factors: how many guidelines are exceeded, how often they are exceeded, and by how much they are exceeded. A score of 95-100 is “excellent,” 80-94 is “good,” 65-79 is “fair,” 45-64 is “marginal” and a score below 45 is “poor.” The most recent scores are based on data from 2021 to 2023.
Among 165 river monitoring sites across the country, the average score was 76.7. Sites along four major rivers earned a perfect score: the Northeast Magaree River (Nova Scotia), the Restigouche River (New Brunswick), the South Saskatchewan River (Saskatchewan) and the Bow River (Alberta). The Bayonne River, a tributary of the St. Lawrence River near Berthierville, Quebec, scored the lowest (33.0).
Overall, between 2021 and 2023, 83.0 per cent of monitoring sites across the country recorded fair to excellent water quality. This is a strong positive signal that most of Canada’s rivers are in generally healthy environmental condition.
A total of 13.3 per cent of stations were deemed to be marginal, that is, they received a score of 45-64 on the index. Only 3.6 per cent of monitoring sites fell into the poor category, meaning that severe degradation was limited to only a few sites (6 of 165).
Monitoring sites along waterways with relatively less development in the river’s headwaters and those with lower population density tended to earn higher scores than sites with developed land uses. However, among the 11 river monitoring sites that rated “excellent,” 8 were situated in areas facing a combination of pressures from nearby human activities that can influence water quality. This indicates the resilience of Canada’s river ecosystems, even in areas facing a combination of multiple stressors from urban runoff, agriculture, and industrial activities where waterways would otherwise be expected to be the most polluted.
Poor or marginal water quality was relatively more common in monitoring sites located along the St. Lawrence River and its major tributaries and near the Great Lakes compared to other regions. Among all sites in the marginal or poor category, 50 per cent were in this area. The Great Lakes-St. Lawrence region is one of the most population-dense and extensively developed parts of Canada, supporting a mix of urban, agricultural, and industrial land uses. These pressures can introduce harmful chemical contaminants and alter nutrient balances in waterways, impairing ecosystem health.
In general, monitoring sites categorized as marginal or poor tended to be located near intensive agriculture and industrial activities. However, it’s important to reiterate that only 28 stations representing 17.0 per cent of all monitoring stations were deemed to be marginal or poor.
Provincial results vary, as shown in the figure below. Water quality scores in Newfoundland and Labrador, Prince Edward Island, New Brunswick, Saskatchewan and Alberta were, on average, 80 points or higher during the period from 2021 to 2023, indicating that water quality rarely departed from natural or desirable levels.
Rivers sites in Nova Scotia, Ontario, Manitoba and B.C. each had average scores between 74 and 78 points, suggesting occasional departures from natural or desirable levels.
Finally, Quebec’s average river water quality score was 64.5 during the 2021 to 2023 period. This score indicates that water quality departed from ideal conditions more frequently in Quebec than in other provinces, especially compared to provinces like Alberta, Saskatchewan and P.E.I. where no sites rated below “fair.”

Overall, these results highlight Canada’s success in maintaining a generally high quality of water in our rivers. Most waterways are in good shape, though some regions—especially near the Great Lakes and along the St. Lawrence River Valley—continue to face pressures from the combined effects of population growth and intensive land use.
Business
State of the Canadian Economy: Number of publicly listed companies in Canada down 32.7% since 2010

From the Fraser Institute
By Ben Cherniavsky and Jock Finlayson
Initial public offerings down 94% since 2010, reflecting country’s economic stagnation
Canadian equity markets are flashing red lights reflective of the larger stagnation, lack of productivity growth and lacklustre innovation of the
country’s economy, with the number of publicly listed companies down 32.7 per cent and initial public offerings down 92.5 per cent since 2010, finds a new report published Friday by the Fraser Institute, an independent, non-partisan Canadian public policy think-tank.
“Even though the value of the companies trading on Canada’s stock exchanges has risen substantially over time, there has been an alarming decrease in the number of companies listed on the exchanges as well as the number of companies choosing to go public,” said Ben Cherniavsky, co-author of Canada’s Shrinking Stock Market: Causes and Implications for Future Economic Growth.
The study finds that over the past 15 years, the number of companies listed on Canada’s two stock markets (the TSX and the TSXV) has fallen from 3,141 in 2010 to 2,114 in 2024—a 32.7 per cent decline.
Similarly, the number of new public stock listings (IPOs) on the two Canadian exchanges has also plummeted from 67 in 2010 to just four in 2024, and only three the year before.
Previous research has shown that well-functioning, diverse public stock markets are significant contributors to economic growth, higher productivity and innovation by supplying financing (i.e. money) to the business sector to enable growth and ongoing investments.
At the same time, the study also finds an explosion of investment in what’s known as private equity in Canada, increasing assets under management from $21.7 billion (US) in 2010 to over $93.1 billion (US) in 2024.
“The shift to private equity has enormous implications for average investors, since it’s difficult if not impossible for average investors to access private equity funds for their savings and investments,” explained Cherniavsky.
Crucially, the study makes several recommendations to revitalize Canada’s stagnant capital markets, including reforming Canada’s complicated regulatory regime for listed companies, scaling back corporate disclosure requirements, and pursuing policy changes geared to improving Canada’s lacklustre performance on business investment, productivity growth, and new business formation.
“Public equity markets play a vital role in raising capital for the business sector to expand, and they also provide an accessible and low-cost way for Canadians to invest in the commercial success of domestic businesses,” said Jock Finlayson, a senior fellow with the Fraser Institute and study co-author.
“Policymakers and all Canadians should be concerned by the alarming decline in the number of publicly traded companies in Canada, which risks economic stagnation and lower living standards ahead.”
Canada’s Shrinking Stock Market: Causes and Implications for Future Economic Growth
- Public equity markets are an important part of the wider financial system.
- Since the early 2000s, the number of public companies has fallen in many countries, including Canada. In 2008, for instance, Canada had 3,520 publicly traded companies on its two exchanges, compared to 2,114 in 2024.
- This trend reflects [1] the impact of mergers and acquisitions, [2] greater access to private capital, [3] increasing regulatory and governance costs facing publicly traded businesses, and [4] the growth of index investing.
- Canada’s poor business climate, including many years of lacklustre business investment and little or no productivity growth, has also contributed to the decline in stock exchange listings.
- The number of new public stock listings (IPOs) on Canadian exchanges has plummeted: between 2008 and 2013, the average was 47 per year, but this dropped to 16 between 2014 and 2024, with only 5 new listings recorded in 2024.
- At the same time, the value of private equity in Canada has skyrocketed from $12.8 billion in 2008 to $93.2 billion in 2024. These trends are concerning, as most Canadians cannot easily access private equity investment vehicles, so their domestic investment options are shrinking.
- The growth of index investing is contributing to the decline in public listings, particularly among smaller companies. In 2008, there were 1,232 listed companies on the TSX Composite and 84 exchange-traded funds; in 2024, there were only 709 listed companies on the TSX and 1,052 exchange-traded funds.
- The trends discussed in this study are also important because Canada has relied more heavily than other jurisdictions on public equity markets to finance domestic businesses.
- Revitalizing Canada’s stagnant stock markets requires policy reforms, particularly regulatory changes to reduce costs to issuers and policies to improve the conditions for private-sector investment and business growth.

Ben Cherniavsky

Jock Finlayson


Residential school burials controversy continues to fuel wave of church arsons, new data suggests

Canada Hits the Brakes on Population
Canadian gov’t considers sharing census data on gender-confused children

Canada’s sudden rediscovery of energy ambition has been greeted with a familiar charge: hypocrisy

Brown University shooter dead of apparent self-inflicted gunshot wound

Paris Climate Deal Now Decade-Old Disaster

Deadlocked Jury Zeroes In on Alleged US$40 Million PPE Fraud in Linda Sun PRC Influence Case
-
 Health2 days ago
FDA warns ‘breast binder’ manufacturers to stop marketing to gender-confused girls
-
 Uncategorized1 day ago
Mortgaging Canada’s energy future — the hidden costs of the Carney-Smith pipeline deal
-
 Agriculture2 days ago
Supply Management Is Making Your Christmas Dinner More Expensive
-
 International2 days ago
2025: The Year The Narrative Changed
-
 Business1 day ago
There’s No Bias at CBC News, You Say? Well, OK…
-
 Daily Caller2 days ago
Trump Reportedly Escalates Pressure On Venezuela With Another Oil Tanker Seizure
-
 International1 day ago
Australian PM booed at Bondi vigil as crowd screams “shame!”
-
 Opinion1 day ago
Religion on trial: what could happen if Canada passes its new hate speech legislation