Economy
Federal government estimates don’t reflect true costs of national pharmacare

From the Fraser Institute
By Grady Munro and Mackenzie Moir

By borrowing to fund national pharmacare, the government can temporarily conceal the direct cost to Canadians, but Canadians inevitably must pay for this spending through higher taxes—something polling on national pharmacare suggests is a deal-breaker for many.
According to a new report from the Parliamentary Budget Officer (PBO), the price tag for the Trudeau government’s national pharmacare program is already expected to exceed the government’s original estimate. And the program will likely continue to grow more expensive.
In mid-April, the government reported the “first phase” of national pharmacare would cost $1.5 billion over five years, starting in 2024/25. For this first phase, which would “expand and enhance” existing public coverage of contraception and diabetes medications, the federal government must negotiate with each province and territory regarding the implementation of national coverage.
Yet just one month after the federal government released its cost estimate, the PBO now reports that this phase of national pharmacare will cost $1.9 billion over five years. In other words, before Ottawa has negotiated any deals with the provinces, the expected costs of national pharmacare have already increased by approximately $400 million.
It should come as no surprise. Since February, when the government and the federal NDP struck their pharmacare deal, the government has failed to acknowledge the program’s true costs. By borrowing to fund national pharmacare, the government can temporarily conceal the direct cost to Canadians, but Canadians inevitably must pay for this spending through higher taxes—something polling on national pharmacare suggests is a deal-breaker for many.
It’s also important to remember this is the first phase of national pharmacare, and the Trudeau government likely plans to further expand coverage to a list of “essential prescription drugs and related products.” Consequently, according to previous PBO estimates, costs of the fully-implemented program may reach $13.4 billion in annual federal and provincial spending by 2027/28.
Crucially, the cost estimates by both the federal government and the PBO fail to account for how Canadians and insurance organizations might respond to national pharmacare.
For example, in their most recent estimates they assume that nobody already covered by some type of drug insurance plan (this was 81 per cent of Canadians in 2019) will switch to the new national plan, or that no public or private insurers will adjust or renegotiate their plans. For Canadians previously insured privately but switch to the national plan, pharmacare will shift some portion of the costs currently borne by private providers onto the federal government. This will further increase the program’s price tag, which again is ultimately paid by taxpayers.
As the Trudeau government continues to implement national pharmacare, Canadians should be aware that current cost estimates don’t accurately reflect the true costs of the program. A larger-than-expected bill for Canadians is more than likely.
Authors:


From the Fraser Institute
By Jake Fuss and Grady Munro
There would have been 1.5 million more Canadians who donated to charity in 2023—and $755.5 million more in donations—had Canadians given to the same extent they did 10 years prior
According to recent polling, approximately one in five Canadians have skipped paying a bill over the past year so they can buy groceries. As families are increasingly hard-pressed to make ends meet, this undoubtedly means more and more people must seek out food banks, shelters and other charitable organizations to meet their basic necessities.
And each year, Canadians across the country donate their time and money to charities to help those in need—particularly around the holiday season. Yet at a time when the relatively high cost of living means these organizations need more resources, new data published by the Fraser Institute shows that the level of charitable giving in Canada is actually falling.
Specifically, over the last 10 years (2013 to 2023, the latest year of available data) the share of tax-filers who reported donating to charity fell from 21.9 per cent to 16.8 per cent. And while fewer Canadians are donating to charity, they’re also donating a smaller share of their income—during the same 10-year period, the share of aggregate income donated to charity fell from 0.55 per cent to 0.52 per cent.
To put this decline into perspective, consider this: there would have been 1.5 million more Canadians who donated to charity in 2023—and $755.5 million more in donations—had Canadians given to the same extent they did 10 years prior. Simply put, this long-standing decline in charitable giving in Canada ultimately limits the resources available for charities to help those in need.
On the bright side, despite the worrying long-term trends, the share of aggregate income donated to charity recently increased from 0.50 per cent in 2022 to 0.52 per cent in 2023. While this may seem like a marginal improvement, 0.02 per cent of aggregate income for all Canadians in 2023 was $255.7 million.
The provinces also reflect the national trends. From 2013 to 2023, every province saw a decline in the share of tax-filers donating to charity. These declines ranged from 15.4 per cent in Quebec to 31.4 per cent in Prince Edward Island.
Similarly, almost every province recorded a drop in the share of aggregate income donated to charity, with the largest being the 24.7 per cent decline seen in P.E.I. The only province to buck this trend was Alberta, which saw a 3.9 per cent increase in the share of aggregate income donated over the decade.
Just as Canada as a whole saw a recent improvement in the share of aggregate income donated, so too did many of the provinces. Indeed, seven provinces (except Manitoba, Nova Scotia and Newfoundland and Labrador) saw an increase in the share of aggregate income donated to charity from 2022 to 2023, with the largest increases occurring in Saskatchewan (7.9 per cent) and Alberta (6.7 per cent).
Canadians also volunteer their time to help those in need, yet the latest data show that volunteerism is also on the wane. According to Statistics Canada, the share of Canadians who volunteered (both formally and informally) fell by 8 per cent from 2018 to 2023. And the total numbers of hours volunteered (again, both formal and informal) fell by 18 per cent over that same period.
With many Canadians struggling to make ends meet, food banks, shelters and other charitable organizations play a critical role in providing basic necessities to those in need. Yet charitable giving—which provides resources for these charities—has long been on the decline. Hopefully, we’ll see this trend turn around swiftly.

From the Fraser Institute
Do economic rivalries between Texas and California or New York and Florida feel like yet another sign that America has become hopelessly divided? There’s a bright side to their disagreements, and a new ranking of economic freedom across the states helps explain why.
As a popular bumper sticker among economists proclaims: “I heart federalism (for the natural experiments).” In a federal system, states have wide latitude to set priorities and to choose their own strategies to achieve them. It’s messy, but informative.
New York and California, along with other states like New Mexico, have long pursued a government-centric approach to economic policy. They tax a lot. They spend a lot. Their governments employ a large fraction of the workforce and set a high minimum wage.
They aren’t socialist by any means; most property is still in private hands. Consumers, workers and businesses still make most of their own decisions. But these states control more resources than other states do through taxes and regulation, so their governments play a larger role in economic life.
At the other end of the spectrum, New Hampshire, Tennessee, Florida and South Dakota allow citizens to make more of their own economic choices, keep more of their own money, and set more of their own terms of trade and work.
They aren’t free-market utopias; they impose plenty of regulatory burdens. But they are economically freer than other states.
These two groups have, in other words, been experimenting with different approaches to economic policy. Does one approach lead to higher incomes or faster growth? Greater economic equality or more upward mobility? What about other aspects of a good society like tolerance, generosity, or life satisfaction?
For two decades now, we’ve had a handy tool to assess these questions: The Fraser Institute’s annual “Economic Freedom of North America” index uses 10 variables in three broad areas—government spending, taxation, and labor regulation—to assess the degree of economic freedom in each of the 50 states and the territory of Puerto Rico, as well as in Canadian provinces and Mexican states.
It’s an objective measurement that allows economists to take stock of federalism’s natural experiments. Independent scholars have done just that, having now conducted over 250 studies using the index. With careful statistical analyses that control for the important differences among states—possibly confounding factors such as geography, climate, and historical development—the vast majority of these studies associate greater economic freedom with greater prosperity.
In fact, freedom’s payoffs are astounding.
States with high and increasing levels of economic freedom tend to see higher incomes, more entrepreneurial activity and more net in-migration. Their people tend to experience greater income mobility, and more income growth at both the top and bottom of the income distribution. They have less poverty, less homelessness and lower levels of food insecurity. People there even seem to be more philanthropic, more tolerant and more satisfied with their lives.
New Hampshire, Tennessee, and South Dakota topped the latest edition of the report while Puerto Rico, New Mexico, and New York rounded out the bottom. New Mexico displaced New York as the least economically free state in the union for the first time in 20 years, but it had always been near the bottom.
The bigger stories are the major movers. The last 10 years’ worth of available data show South Carolina, Ohio, Wisconsin, Idaho, Iowa and Utah moving up at least 10 places. Arizona, Virginia, Nebraska, and Maryland have all slid down 10 spots.
Over that same decade, those states that were among the freest 25 per cent on average saw their populations grow nearly 18 times faster than those in the bottom 25 per cent. Statewide personal income grew nine times as fast.
Economic freedom isn’t a panacea. Nor is it the only thing that matters. Geography, culture, and even luck can influence a state’s prosperity. But while policymakers can’t move mountains or rewrite cultures, they can look at the data, heed the lessons of our federalist experiment, and permit their citizens more economic freedom.

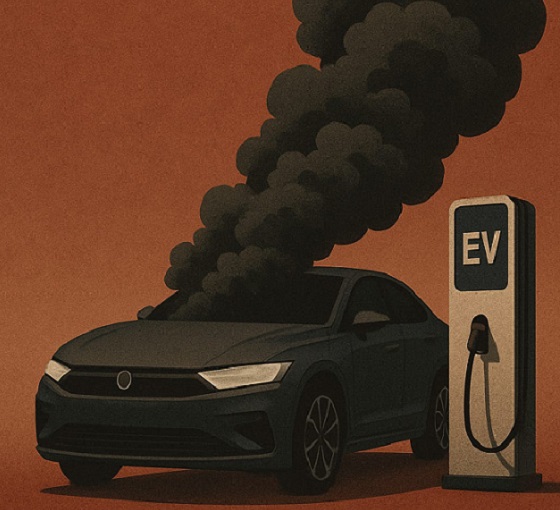
The $50 Billion Question: EVs Never Delivered What Ottawa Promised

The Recall Trap: 21 Alberta MLA’s face recall petitions

Liberals gain support for ‘hate speech’ bill targeting Bible passages against homosexuality

Canada’s free speech record is cracking under pressure

Storm clouds of uncertainty as BC courts deal another blow to industry and investment

Wisdom of Our Elders: The Contempt for Memory in Canadian Indigenous Policy

Taxpayers Federation calls on politicians to reject funding for new Ottawa Senators arena
-
 Business24 hours ago
Major tax changes in 2026: Report
-
 Digital ID13 hours ago
Canada releases new digital ID app for personal documents despite privacy concerns
-
 Energy12 hours ago
Canada’s sudden rediscovery of energy ambition has been greeted with a familiar charge: hypocrisy
-
 Alberta1 day ago
Schools should go back to basics to mitigate effects of AI
-
 Daily Caller23 hours ago
Chinese Billionaire Tried To Build US-Born Baby Empire As Overseas Elites Turn To American Surrogates
-
 International22 hours ago
Russia Now Open To Ukraine Joining EU, Officials Briefed On Peace Deal Say
-
 Censorship Industrial Complex22 hours ago
Death by a thousand clicks – government censorship of Canada’s internet
-
 International1 day ago
At Least 15 Killed In Shooting Targeting Jewish Community At Australia’s Bondi Beach, Police Say