Fraser Institute
Canadian generosity hits lowest point in 20 years
From the Fraser Institute
The number of Canadians donating to charity—as a percentage of all tax filers—is at the lowest point in 20 years, finds a new study published by the Fraser Institute, an independent, non-partisan Canadian public policy think-tank.
“The holiday season is a time to reflect on charitable giving, and the data shows Canadians are consistently less charitable every year, which means charities face greater challenges to secure resources to help those in need,” said Jake Fuss, director of Fiscal Studies at the Fraser Institute and co-author of Generosity in Canada: The 2024 Generosity Index.
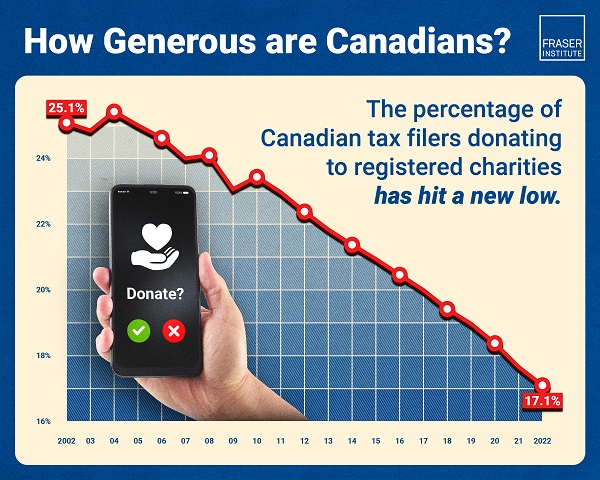
The study finds that the percentage of Canadian tax filers donating to charity during the 2022 tax year—just 17.1 per cent—is the lowest proportion of Canadians donating since at least 2002.
Canadians’ generosity peaked at 25.4 per cent of tax-filersdonating in 2004, before declining in subsequent years.
Nationally, the total amount donated to charity by Canadian tax filers has also fallen from 0.61 per cent of income in 2002 to 0.50 per cent of income in 2022.
The study finds that Manitoba had the highest percentage of tax filers that donated to charity among the provinces (19.3 per cent) during the 2022 tax year while New Brunswick had the lowest (14.7 per cent).
Likewise, Manitoba also donated the highest percentage of its aggregate income to charity among the provinces (0.71 per cent) while Quebec donated the lowest (0.26 per cent).
“A smaller proportion of Canadians are donating to registered charities than what we saw in previous decades, and those who are donating are donating less,” said Fuss.
“This decline in generosity in Canada undoubtedly limits the ability of Canadian charities to improve the quality of life in their communities and beyond,” said Grady Munro, policy analyst and co-author.

NOTE: Table based on 2022 tax year, the most recent year of comparable data in Canada
Generosity in Canada: The 2024 Generosity Index
- Manitoba had the highest percentage of tax filers that donated to charity among the provinces (19.3%) during the 2022 tax year while New Brunswick had the lowest (14.7%).
- Manitoba also donated the highest percentage of its aggregate income to charity among the provinces (0.71%) while Quebec donated the lowest (0.26%).
- Nationally, the percentage of Canadian tax filers donating to charity has fallen over the last decade from 22.4% in 2012 to 17.1% in 2022.
- The percentage of aggregate income donated to charity by Canadian tax filers has also decreased from 0.55% in 2012 to 0.50% in 2022.
- This decline in generosity in Canada undoubtedly limits the ability of Canadian charities to improve the quality of life in their communities and beyond.

Jake Fuss

Grady Munro

From the Fraser Institute
By Matthew Lau
It’s now more than four years since the federal Liberal government pledged $30 billion in spending over five years for $10-per-day national child care, and more than three years since Ontario’s Progressive Conservative government signed a $13.2 billion deal with the federal government to deliver this child-care plan.
Not surprisingly, with massive government funding came massive government control. While demand for child care has increased due to the government subsidies and lower out-of-pocket costs for parents, the plan significantly restricts how child-care centres operate (including what items participating centres may purchase), and crucially, caps the proportion of government funds available to private for-profit providers.
What have families and taxpayers got for this enormous government effort? Widespread child-care shortages across Ontario.
For example, according to the City of Ottawa, the number of children (aged 0 to 5 years) on child-care waitlists has ballooned by more than 300 per cent since 2019, there are significant disparities in affordable child-care access “with nearly half of neighbourhoods underserved, and limited access in suburban and rural areas,” and families face “significantly higher” costs for before-and-after-school care for school-age children.
In addition, Ottawa families find the system “complex and difficult to navigate” and “fewer child care options exist for children with special needs.” And while 42 per cent of surveyed parents need flexible child care (weekends, evenings, part-time care), only one per cent of child-care centres offer these flexible options. These are clearly not encouraging statistics, and show that a government-knows-best approach does not properly anticipate the diverse needs of diverse families.
Moreover, according to the Peel Region’s 2025 pre-budget submission to the federal government (essentially, a list of asks and recommendations), it “has maximized its for-profit allocation, leaving 1,460 for-profit spaces on a waitlist.” In other words, families can’t access $10-per-day child care—the central promise of the plan—because the government has capped the number of for-profit centres.
Similarly, according to Halton Region’s pre-budget submission to the provincial government, “no additional families can be supported with affordable child care” because, under current provincial rules, government funding can only be used to reduce child-care fees for families already in the program.
And according to a March 2025 Oxford County report, the municipality is experiencing a shortage of child-care staff and access challenges for low-income families and children with special needs. The report includes a grim bureaucratic predication that “provincial expansion targets do not reflect anticipated child care demand.”
Child-care access is also a problem provincewide. In Stratford, which has a population of roughly 33,000, the municipal government reports that more than 1,000 children are on a child-care waitlist. Similarly in Port Colborne (population 20,000), the city’s chief administrative officer told city council in April 2025 there were almost 500 children on daycare waitlists at the beginning of the school term. As of the end of last year, Guelph and Wellington County reportedly had a total of 2,569 full-day child-care spaces for children up to age four, versus a waitlist of 4,559 children—in other words, nearly two times as many children on a waitlist compared to the number of child-care spaces.
More examples. In Prince Edward County, population around 26,000, there are more than 400 children waitlisted for licensed daycare. In Kawartha Lakes and Haliburton County, the child-care waitlist is about 1,500 children long and the average wait time is four years. And in St. Mary’s, there are more than 600 children waitlisted for child care, but in recent years town staff have only been able to move 25 to 30 children off the wait list annually.
The numbers speak for themselves. Massive government spending and control over child care has created havoc for Ontario families and made child-care access worse. This cannot be a surprise. Quebec’s child-care system has been largely government controlled for decades, with poor results. Why would Ontario be any different? And how long will Premier Ford allow this debacle to continue before he asks the new prime minister to rethink the child-care policy of his predecessor?

Matthew Lau
Adjunct Scholar, Fraser Institute
From the Fraser Institute
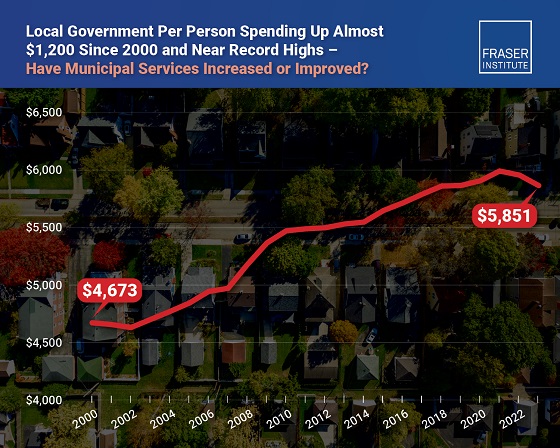
Municipal government spending in Canada hit near record levels in recent years, finds a new study by the Fraser Institute, an independent, non-partisan Canadian public policy think-tank.
“In light of record-high spending in municipalities across Canada, residents should consider whether or not crime, homelessness, public transit and other services have actually improved,” said Austin Thompson, senior policy analyst at the Fraser Institute and author of The Expanding Finances of Local Governments in Canada.
From 2000 to 2023, per-person spending (inflation-adjusted) increased by 25.2 per cent, reaching a record-high $5,974 per person in 2021 before declining slightly to $5,851 in 2023, the latest year of available data.
During that same period, municipal government revenue—generated from property taxes and transfers from other levels of government—increased by 33.7 per cent per person (inflation-adjusted).
And yet, among all three levels of government including federal and provincial, municipal government spending (adjusted for inflation) has actually experienced the slowest rate of growth over the last 10 years, underscoring the large spikes in spending at all government levels across Canada.
“Despite claims from municipal policymakers about their dire financial positions, Canadians should understand the true state of finances at city hall so they can decide whether they’re getting good value for their money,” said Jake Fuss, director of fiscal studies at the Fraser Institute.
The Expanding Finances of Local Governments in Canada, 1990–2023
- Canada’s local governments have experienced substantial fiscal growth in recent decades.
- Revenue and expenditure by local governments—including municipal governments, school boards, and Indigenous governments—have increased faster than population growth and inflation combined. From 1990 to 2023, real per-capita revenue rose by 32.7%, and expenditure by 30.0%.
- Local governments represent a significant component of Canada’s broader public sector. In 2023, net of inter-governmental transfers, municipal governments and school boards accounted for 18.6% of total government expenditure and 11.1% of revenue.
- Despite this growth, local governments’ share of overall government revenue and expenditure has declined over time—especially since the COVID-19 pandemic—as federal and provincial budgets have expanded even more rapidly.
- Nevertheless, between 2008 and 2023 the inflation-adjusted per-capita revenue of municipal governments in-creased by 10.1% and their expenditure by 12.4% , on average across the provinces.
- Over the same period, municipal governments recorded above-inflation increases in their combined annual operating surpluses, which contributed to an 88.1% inflation-adjusted rise in their net worth—raising important questions about the allocation of accumulated resources.
- In 2023, Ontario recorded the highest per-capita municipal revenue among the provinces ($4,156), while Alberta had the highest per-capita expenditure ($3,750). Prince Edward Island reported the lowest per-capita municipal revenue ($1,635) and expenditure ($1,186).
- Wide variation in per-capita municipal revenue and expenditure across the provinces reflects differences in the responsibilities provinces assign to municipalities, as well as possible disparities in the efficiency of service delivery—issues that warrant further scrutiny.
Click Here To Read The Full Study


So Alberta, what’s next?

The Physics Behind The Spanish Blackout

War over after 12 days? Ceasefire reached between Israel, Iran

Canada should already be an economic superpower. Why is Canada not doing better?

Alberta Next Takes A Look At Alberta Provincial Police Force

‘Transgender’ males have 51% higher death rate than general population: study

President Xi Skips Key Summit, Adding Fuel to Ebbing Power Theories
-
 Brownstone Institute2 days ago
FDA Exposed: Hundreds of Drugs Approved without Proof They Work
-
 Energy1 day ago
China undermining American energy independence, report says
-
 Business1 day ago
Trump on Canada tariff deadline: ‘We can do whatever we want’
-
 Automotive1 day ago
Electric vehicle sales are falling hard in BC, and it is time to recognize reality.
-
 Business1 day ago
Europe backs off greenwashing rules — Canada should take note
-
 Automotive1 day ago
Power Struggle: Electric vehicles and reality
-
 Business7 hours ago
Canada Caves: Carney ditches digital services tax after criticism from Trump
-
 Bruce Dowbiggin7 hours ago
The Game That Let Canadians Forgive The Liberals — Again