David Clinton
Are We Winning the Patient-to-Doctor Ratio War?


 By
By The fact that millions of Canadians lack primary healthcare providers is a big deal. The grand promise of universal healthcare rings hollow for families forced to spend six hours waiting in a hospital emergency room for a simple ear infection diagnosis.
Just how big a deal is it? Statistics Canada data from 2021 ranks provinces by their ability to provide primary health providers. As you can see from the chart, New Brunswick and Ontario were doing the best, with doctors for nearly 90 percent of their residents. Quebec, able to find providers for just 78.4 percent of their population, landed at the bottom. But even just 10-15 percent without proper coverage is a serious systemic failure.
 |
Since healthcare is administered by the provinces, it makes sense to assume that provincial policies will influence results. So comparing access to primary care practice results over time might help us understand what’s working and what isn’t.
The Audit is a reader-supported publication.
To receive new posts and support my work, consider becoming a free or paid subscriber.
To that end, I pulled Statistics Canada data tracking total employment in offices of physicians (NAICS code 621111) by province. The data covers all employees (including nurses, office managers, and receptionists) in all non-hospital medical offices providing services that don’t include mental health.
I originally searched unsuccessfully for usable data specific to doctors. But as it turns out, such data would have included surgeons and other hospital-based specialties when I’m really looking for general (family) care providers. So I think what we got will actually act as a better proxy for primary care access.
Do keep in mind that staffing levels in the sector represent just one of many statistical signals we could use to understand the healthcare universe. And it’s just a proxy that’s not necessarily a perfect map to reality.
In any case, I adjusted the numbers by provincial populations so they’d make statistical sense. The chart below contains ratios representing how many residents there are per worker between 2010 and 2023:
 |
You might notice that PEI is missing from that chart. That’s because the reported numbers fell below Statistics Canada’s privacy threshold for most of the covered years.
Alberta, with a ratio of just 282:1 is the current champion, while Newfoundland (438:1) has the worst record. But changes over time are where things get interesting. BC’s performance declined by more than 11 percent. And Quebec improved by more than 40 percent!
As you can see for yourself in that chart, Quebec’s most dramatic growth took place between 2016 and 2019. What was going on around that time? Well, both Bill 10 and Bill 20 were introduced in 2015.
- Bill 10 restructured the healthcare system by reducing the number of administrative regions and centralizing governance to streamline services and improve efficiency.
- Bill 20 established patient quotas for doctors, mandating a minimum number of patients they were required to see. Physicians who did not meet these quotas faced penalties, such as reduced compensation.
I don’t need to speak French to assume that those measures must have inspired an awful lot of anger and push back from within the medical profession. But the results speak for themselves.
Or do they? You see there’s something else about Quebec we can’t ignore: Chaoulli v. Quebec (2005). That’s the Supreme Court of Canada case where the Canada Health Act’s ban on private delivery of healthcare was ruled unconstitutional (for Quebec, at any rate).
As a direct result of that decision, there are now more than 50 procedures that can be performed in private surgical clinics in the province. The number of private clinics nearly doubled between 2014 and 2023.
Predictably, wait times for surgeries fell significantly over that time. But the numbers of non-hospital employees would probably have climbed at the same rate. That could possibly go further to explain Quebec’s steady and consistent improvements in our data.
What about the other provinces? There have been structural changes to delivery policies in recent years, but they’re mostly too new to have produced a measurable impact. But here’s a brief overview of what’s being tried:
- This Toronto Star piece describes efforts in both Ontario and BC involving plans among some smaller municipalities to build and manage family health practices and pay their doctors as employees. The idea is that many doctors will prefer to avoid the headaches of starting and running their own businesses and would prefer instead to work for someone else. The obvious goal is to attract new doctors to underserved communities. It’s still way too soon to know whether they’ll be successful in the desperate race for the shrinking pool of family physicians.
- Both Ontario and Alberta have championed Family Health Groups (FHGs), where physicians receive additional incentives for providing comprehensive care. Ontario’s Family Health Networks (FHN) and Family Health Organizations (FHO) also compensate physicians based on the number and demographics of enrolled patients.
- British Columbia and Nova Scotia have implemented variations of a Longitudinal Family Physician (LFP) Payment Model. LFPs compensate family physicians based on factors like time spent with patients, patient panel size, and the complexity of care. They claim to promote team-based, patient-partnered care.
The Audit is a reader-supported publication.
To receive new posts and support my work, consider becoming a free or paid subscriber.
Invite your friends and earn rewards

 David Clinton
Who ya gonna believe: official CPI figures or your lyin’ eyes?
Great news! We’ve brought inflation back under control and stuff is now only costing you 2.4 percent more than it did last year!
That’s more or less the message we’ve been hearing from governments over the past couple of years. And in fact, the official Statistics Canada consumer price index (CPI) numbers do show us that the “all-items” index in 2024 was only 2.4 percent higher than in 2023. Fantastic.
So why doesn’t it feel fantastic?
Well statistics are funny that way. When you’ve got lots of numbers, there are all kinds of ways to dress ‘em up before presenting them as an index (or chart). And there really is no one combination of adjustments and corrections that’s definitively “right”. So I’m sure Statistics Canada isn’t trying to misrepresent things.
But I’m also curious to test whether the CPI is truly representative of Canadians’ real financial experiences. My first attempt to create my own alternative “consumer price index”, involved Statistics Canada’s “Detailed household final consumption expenditure”. That table contains actual dollar figures for nation-wide spending on a wide range of consumer items. To represent the costs Canadian’s face when shopping for basics, I selected these nine categories:
- Food and non-alcoholic beverages
- Clothing and footwear
- Housing, water, electricity, gas and other fuels
- Major household appliances
- Pharmaceutical products and other medical products (except cannabis)
- Transport
- Communications
- University education
- Property insurance
I then took the fourth quarter (Q4) numbers for each of those categories for all the years between 2013 and 2024 and divided them by the total population of the country for each year. That gave me an accurate picture of per capita spending on core cost-of-living items.
Overall, living and breathing through Q4 2013 would have cost the average Canadian $4,356.38 (or $17,425.52 for a full year). Spending for those same categories in Q4 2024, however, cost us $6,266.48 – a 43.85 percent increase.
By contrast, the official CPI over those years rose only 31.03 percent. That’s quite the difference. Here’s how the year-over-year changes in CPI inflation vs actual spending inflation compare:
 |
As you can see, with the exception of 2020 (when COVID left us with nothing to buy), the official inflation number was consistently and significantly lower than actual spending. And, in the case of 2021, it was more than double.
Since 2023, the items with the largest price growth were university education (57.46 percent), major household appliances (52.67 percent), and housing, water, electricity, gas, and other fuels (50.79).
Having said all that, you could justifiably argue that the true cost of living hasn’t really gone up that much, but that at least part of the increase in spending is due to a growing taste for luxury items and high volume consumption. I can’t put a precise number on that influence, but I suspect it’s not trivial.
Since data on spending doesn’t seem to be the best measure of inflation, perhaps I could build my own basket of costs and compare those numbers to the official CPI. To do that, I collected average monthly costs for gasoline, home rentals, a selection of 14 core grocery items, and taxes paid by the average Canadian homeowner.¹ I calculated the tax burden (federal, provincial, property, and consumption) using the average of the estimates of two AI models.
How did the inflation represented by my custom basket compare with the official CPI? Well between 2017 and 2024, the Statistics Canada’s CPI grew by 23.39 percent. Over that same time, the monthly cost of my basket grew from $4,514.74 to $5,665.18; a difference of 25.48 percent. That’s not nearly as dramatic a difference as we saw when we measured spending, but it’s not negligible either.
The very fact that the government makes all this data freely available to us is evidence that they’re not out to hide the truth. But it can’t hurt to keep an active and independent eye on them, too.
Subscribe to The Audit.
For the full experience, upgrade your subscription.

From The Audit

State capacity is the measure of a government’s ability to get stuff done that benefits its population. There are many ways to quantify state capacity, including GDP per capita spent on health, education, and infrastructure versus outcomes; the tax-to-GDP ratio; judicial independence; enforcement of contracts; and crime rates.
But a government’s ability to actually implement its own policies has got to rank pretty high here, too. All the best intentions are worthless if, as I wrote in the context of the Liberal’s 2023 national action plan to end gender-based violence, your legislation just won’t work in the real world.
The Audit is a reader-supported publication.
To receive new posts and support my work, consider becoming a free or paid subscriber.
So I thought I’d take a look at some examples of federal legislation from the past ten years that passed through Parliament but, for one reason or another, failed to do its job. We may agree or disagree with goals driving the various initiatives, but government’s failure to get the work done over and over again speaks to a striking lack of state capacity.
The 2018 Cannabis Act (Bill C-45). C-45 legalized recreational cannabis in Canada, with a larger goal of regulating production, distribution, and consumption while reducing illegal markets and protecting public health. However, research has shown that illegal sales persisted post-legalization due to high legal prices and taxation. Studies have also shown continued use among children despite regulations. And there are troubling indicators about the overall impact on public health.
The 2021 Canadian Net-Zero Emissions Accountability Act (Bill C-12). The legislation aimed to ensure Canada achieves net-zero greenhouse gas emissions by 2050 by setting five-year targets and requiring emissions reduction plans. However, critics argue it lacks enforceable mechanisms to guarantee results. A much-delayed progress report highlighted a lack of action and actual emissions reductions lagging far behind projections.
The First Nations Clean Water Act (Bill C-61) was introduced in late 2024 but, as of the recent dissolution of Parliament, not yet passed. This should be seen in the context of the Safe Drinking Water for First Nations Act (2013), which was repealed in 2021 after failing to deliver promised improvements in water quality due to inadequate funding and enforcement. The new bill aimed to address these shortcomings, but a decade and a half of inaction speaks to a special level of public impotence.
The 2019 Impact Assessment Act (Bill C-69). Passed in 2019, this legislation reformed environmental assessment processes for major projects. Many argue it failed to achieve its dual goals of streamlining approvals while enhancing environmental protection. Industry groups claim it created regulatory uncertainty (to put it mildly), while environmental groups argue it hasn’t adequately protected ecosystems. No one seems happy with this one.
The 2019 Firearms Act (Bill C-71). Parts of this firearms legislation were delayed in implementation, particularly the point-of-sale record keeping requirements for non-restricted firearms. Some provisions weren’t fully implemented until years after passage.
The 2013 First Nations Financial Transparency Act. – This legislation, while technically implemented, was not fully enforced after 2015 when the Liberal government stopped penalizing First Nations that didn’t comply with its financial disclosure requirements.
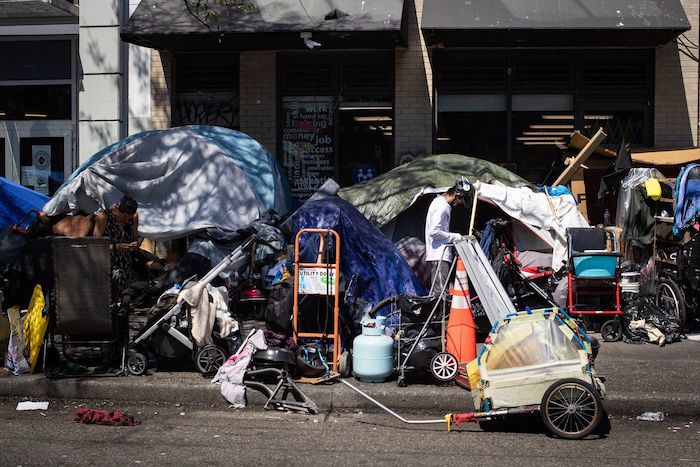
The 2019 National Housing Strategy Act. From the historical perspective of six years of hindsight, the law has manifestly failed to meaningfully address Canada’s housing affordability crisis. Housing prices and homelessness have continued their rise in major urban centers.
The 2019 Indigenous Languages Act (Bill C-91). Many Indigenous advocates have argued the funding and mechanisms have been insufficient to achieve its goal of revitalizing endangered Indigenous languages.
The 2007 Public Servants Disclosure Protection Act (PSDPA). Designed to protect whistleblowers within the federal public service, the PSDPA has been criticized for its ineffectiveness. During its first three years, the Office of the Public Sector Integrity Commissioner (OPSIC) astonishingly reported no findings of wrongdoing or reprisal, despite numerous submissions. A 2017 review by the Standing Committee on Government Operations and Estimates recommended significant reforms, but there’s been no visible progress.
There were, of course, many bills from the past ten years that were fully implemented.¹ But the failure rate is high enough that I’d argue it should be taken into account when measuring our state capacity.
Still, as a friend once noted, there’s a silver lining to all this: the one thing more frightening than an inefficient and ineffective government is an efficient and effective government. So there’s that.
The fact that we’re still living through the tail end of a massive bout of inflation provides clear testimony that Bill C-13 (COVID-19 Emergency Response Act) had an impact.
For the full experience, upgrade your subscription.
Police Associations Endorse Conservatives. Poilievre Will Shut Down Tent Cities

Ottawa Confirms China interfering with 2025 federal election: Beijing Seeks to Block Joe Tay’s Election
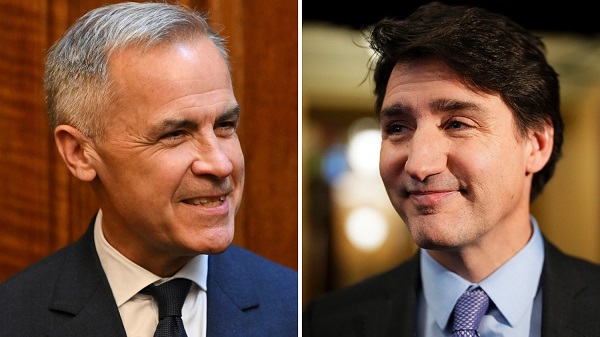
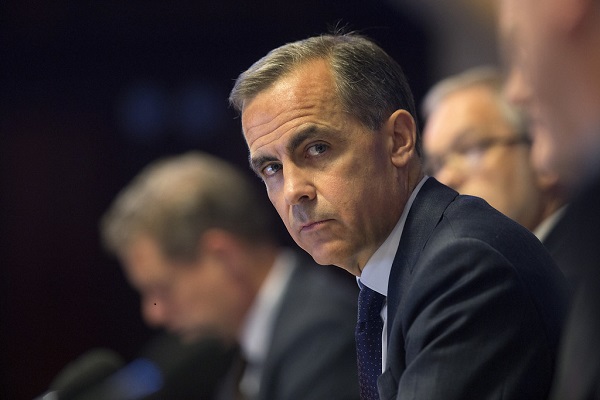
Carney’s Fiscal Fantasy: When the Economist Becomes More Dangerous Than the Drama Teacher

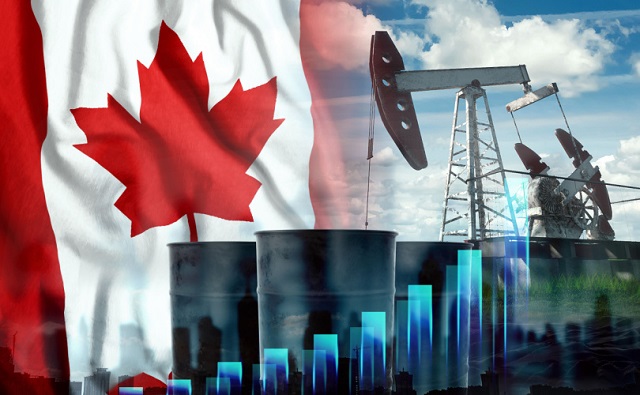
Mark Carney Wants You to Forget He Clearly Opposes the Development and Export of Canada’s Natural Resources
BREAKING: THE FEDERAL BRIEF THAT SHOULD SINK CARNEY
Study links B.C.’s drug policies to more overdoses, but researchers urge caution

A Perfect Storm of Corruption, Foreign Interference, and National Security Failures
-
 conflict2 days ago
Trump tells Zelensky: Accept peace or risk ‘losing the whole country’
-
 2025 Federal Election1 day ago
Poilievre Campaigning To Build A Canadian Economic Fortress
-
 Automotive1 day ago
Canadians’ Interest in Buying an EV Falls for Third Year in a Row
-
 Alberta9 hours ago
Governments in Alberta should spur homebuilding amid population explosion
-
 Entertainment2 days ago
Pedro Pascal launches attack on J.K. Rowling over biological sex views
-
 International8 hours ago
History in the making? Trump, Zelensky hold meeting about Ukraine war in Vatican ahead of Francis’ funeral
-
 Automotive2 days ago
Hyundai moves SUV production to U.S.
-
 2025 Federal Election1 day ago
The Cost of Underselling Canadian Oil and Gas to the USA