Fraser Institute
Dearth of medical resources harms Canadian patients

From the Fraser Institute
The imbalance between high spending and poor access to doctors, hospital beds and vital imaging technology, coupled with untimely access to services, can, and does, have a detrimental impact on patients.
Whether it’s a lack of family physicians or other health-care workers, Canadians know we have a serious health-care labour shortage on our hands. The implications of this shortage aren’t lost on patients (including Ellie O’Brien) who’ve possibly faced delays in accessing organ transplants because potential donors need a regular family doctor to screen them to begin the transplant process.
Given these access issues, coupled with some of the longest recorded wait times for medical procedures on record, is it any wonder that Canadians are dissatisfied with how their provincial governments handle health care?
While one instinct might be to demand governments spend more on health care, it’s not clear we’re getting good value in return for what’s already being spent. In fact, compared to 29 other high-income countries with universal health care, Canada spent the most on health care as a share of the economy at 12.6 per cent in 2021, the latest year of available comparable data (after adjusting for differences in the age structure of each country’s population).
But what do we get in return for this spending?
As far as medical resources go, not a whole lot. In 2021, Canadians had some of the fewest medical resources in the developed world. Out of 30 high-income countries with universal health care, Canada ranked 28th on physician availability at 2.8 per 1,000 people, far behind countries such as seventh-ranked Switzerland (4.5 physicians per 1,000) and tenth-ranked Australia (at 4.3 physicians per 1,000).
But doctors are just one part of the puzzle. Canada also ranked low on available hospital beds (23rd of 29 countries), meaning patients often face delays for hospital care. It can also mean that patients end up being treated for their illness outside a traditional patient room—such as a hospital hallway, a phenomenon that has spread to many provinces.
We also see a low availability of other key medical resources including diagnostic equipment. In 2019, Canada ranked 25th of 29 comparable countries with universal health care on the number of MRIs (10.3 units per million people) compared to top-ranked Japan, which had four times as many MRIs as Canada. And we ranked 26th out of 30 countries on CT scanners (14.9 scanners per million people) compared to second-ranked Australia, which had five times as many CT scanners. It’s also worth noting that a large a portion of Canada’s diagnostic machines are remarkably old.
It’s no accident that countries such as Australia, which actually spend less of its economy on health care compared to Canada, perform better than Canada on measures of resource availability and timeliness of care. Unlike Canada, Australia embraces its private sector as an integral part of its universal health-care system. With 41 per cent of all hospital care in Australia occurring in private hospitals in 2021/22, private hospitals can act as a pressure valve for the entire system, particularly in times of crisis. Indeed, the country outperforms Canada on measures of timely access to family doctor appointments, specialist care and non-emergency surgery, and has done so regularly for years.
The imbalance between high spending and poor access to doctors, hospital beds and vital imaging technology, coupled with untimely access to services, can, and does, have a detrimental impact on patients. For some, this problem can be life threatening. Without genuine reform based on real world lessons from higher performing universal health-care countries including Australia, it’s impossible to reasonably expect our health-care system to improve despite its hefty price tag.
Author:
Business
Canada is failing dismally at our climate goals. We’re also ruining our economy.

From the Fraser Institute
By Annika Segelhorst and Elmira Aliakbari
Short-term climate pledges simply chase deadlines, not results
The annual meeting of the United Nations Conference of the Parties, or COP, which is dedicated to implementing international action on climate change, is now underway in Brazil. Like other signatories to the Paris Agreement, Canada is required to provide a progress update on our pledge to reduce greenhouse gas (GHG) emissions by 40 to 45 per cent below 2005 levels by 2030. After decades of massive government spending and heavy-handed regulations aimed at decarbonizing our economy, we’re far from achieving that goal. It’s time for Canada to move past arbitrary short-term goals and deadlines, and instead focus on more effective ways to support climate objectives.
Since signing the Paris Agreement in 2015, the federal government has introduced dozens of measures intended to reduce Canada’s carbon emissions, including more than $150 billion in “green economy” spending, the national carbon tax, the arbitrary cap on emissions imposed exclusively on the oil and gas sector, stronger energy efficiency requirements for buildings and automobiles, electric vehicle mandates, and stricter methane regulations for the oil and gas industry.
Recent estimates show that achieving the federal government’s target will impose significant costs on Canadians, including 164,000 job losses and a reduction in economic output of 6.2 per cent by 2030 (compared to a scenario where we don’t have these measures in place). For Canadian workers, this means losing $6,700 (each, on average) annually by 2030.
Yet even with all these costly measures, Canada will only achieve 57 per cent of its goal for emissions reductions. Several studies have already confirmed that Canada, despite massive green spending and heavy-handed regulations to decarbonize the economy over the past decade, remains off track to meet its 2030 emission reduction target.
And even if Canada somehow met its costly and stringent emission reduction target, the impact on the Earth’s climate would be minimal. Canada accounts for less than 2 per cent of global emissions, and that share is projected to fall as developing countries consume increasing quantities of energy to support rising living standards. In 2025, according to the International Energy Agency (IEA), emerging and developing economies are driving 80 per cent of the growth in global energy demand. Further, IEA projects that fossil fuels will remain foundational to the global energy mix for decades, especially in developing economies. This means that even if Canada were to aggressively pursue short-term emission reductions and all the economic costs it would imposes on Canadians, the overall climate results would be negligible.
Rather than focusing on arbitrary deadline-contingent pledges to reduce Canadian emissions, we should shift our focus to think about how we can lower global GHG emissions. A recent study showed that doubling Canada’s production of liquefied natural gas and exporting to Asia to displace an equivalent amount of coal could lower global GHG emissions by about 1.7 per cent or about 630 million tonnes of GHG emissions. For reference, that’s the equivalent to nearly 90 per cent of Canada’s annual GHG emissions. This type of approach reflects Canada’s existing strength as an energy producer and would address the fastest-growing sources of emissions, namely developing countries.
As the 2030 deadline grows closer, even top climate advocates are starting to emphasize a more pragmatic approach to climate action. In a recent memo, Bill Gates warned that unfounded climate pessimism “is causing much of the climate community to focus too much on near-term emissions goals, and it’s diverting resources from the most effective things we should be doing to improve life in a warming world.” Even within the federal ministry of Environment and Climate Change, the tone is shifting. Despite the 2030 emissions goal having been a hallmark of Canadian climate policy in recent years, in a recent interview, Minister Julie Dabrusin declined to affirm that the 2030 targets remain feasible.
Instead of scrambling to satisfy short-term national emissions limits, governments in Canada should prioritize strategies that will reduce global emissions where they’re growing the fastest.

Elmira Aliakbari
Alberta
Carney government’s anti-oil sentiment no longer in doubt

From the Fraser Institute
The Carney government, which on Monday survived a confidence vote in Parliament by the skin of its teeth, recently released a “second tranche of nation-building projects” blessed by the Major Projects Office. To have a chance to survive Canada’s otherwise oppressive regulatory gauntlet, projects must get on this Caesar-like-thumbs-up-thumbs-down list.
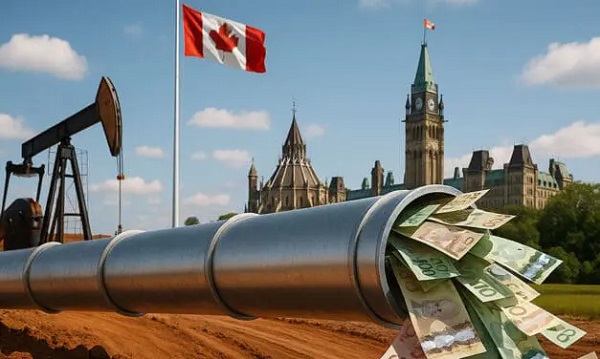
The first tranche of major projects released in September included no new oil pipelines but pertained largely to natural gas, nuclear power, mineral production, etc. The absence of proposed oil pipelines was not surprising, as Ottawa’s regulatory barricade on oil production means no sane private company would propose such a project. (The first tranche carries a price tag of $60 billion in government/private-sector spending.)
Now, the second tranche of projects also includes not a whiff of support for oil production, transport and export to non-U.S. markets. Again, not surprising as the prime minister has done nothing to lift the existing regulatory blockade on oil transport out of Alberta.
So, what’s on the latest list?
There’s a “conservation corridor” for British Columbia and Yukon; more LNG projects (both in B.C.); more mineral projects (nickel, graphite, tungsten—all electric vehicle battery constituents); and still more transmission for “clean energy”—again, mostly in B.C. And Nunavut comes out ahead with a new hydro project to power Iqaluit. (The second tranche carries a price tag of $58 billion in government/private-sector spending.)
No doubt many of these projects are worthy endeavours that shouldn’t require the imprimatur of the “Major Projects Office” to see the light of day, and merit development in the old-fashioned Canadian process where private-sector firms propose a project to Canada’s environmental regulators, get necessary and sufficient safety approval, and then build things.
However, new pipeline projects from Alberta would also easily stand on their own feet in that older regulatory regime based on necessary and sufficient safety approval, without the Carney government additionally deciding what is—or is not—important to the government, as opposed to the market, and without provincial governments and First Nations erecting endless barriers.
Regardless of how you value the various projects on the first two tranches, the second tranche makes it crystal clear (if it wasn’t already) that the Carney government will follow (or double down) on the Trudeau government’s plan to constrain oil production in Canada, particularly products derived from Alberta’s oilsands. There’s nary a mention that these products even exist in the government’s latest announcement, despite the fact that the oilsands are the world’s fourth-largest proven reserve of oil. This comes on the heels on the Carney government’s first proposed budget, which also reified the government’s fixation to extinguish greenhouse gas emissions in Canada, continue on the path to “net-zero 2050” and retain Canada’s all-EV new car future beginning in 2036.
It’s clear, at this point, that the Carney government is committed to the policies of the previous Liberal government, has little interest in harnessing the economic value of Canada’s oil holdings nor the potential global influence Canada might exert by exporting its oil products to Asia, Europe and other points abroad. This policy fixation will come at a significant cost to future generations of Canadians.
-

 Daily Caller2 days ago
Democrats Explicitly Tell Spy Agencies, Military To Disobey Trump
-

 Energy2 days ago
Carney bets on LNG, Alberta doubles down on oil
-

 Alberta2 days ago
Alberta on right path to better health care
-

 Indigenous2 days ago
Top constitutional lawyer slams Indigenous land ruling as threat to Canadian property rights
-

 Daily Caller2 days ago
ALAN DERSHOWITZ: Can Trump Legally Send Troops Into Our Cities? The Answer Is ‘Wishy-Washy’
-

 Alberta2 days ago
Carney government’s anti-oil sentiment no longer in doubt
-

 Alberta2 days ago
Alberta Emergency Alert test – Wednesday at 1:55 PM
-

 Alberta23 hours ago
‘Weird and wonderful’ wells are boosting oil production in Alberta and Saskatchewan


