David Clinton
What Drives Canada’s Immigration Policies?
News release from The Audit

Government decisions have consequences. But they also have reasons.
Dearest readers: I would love to hear what you think about this topic. So please take the very brief survey at the end of the post.
Popular opposition to indiscriminate immigration has been significant and growing in many Western countries. Few in Canada deny our need for more skilled workers, and I think most of us are happy we’re providing a sanctuary for refugees escaping verifiable violence and oppression. We’re also likely united in our support for decent, hard working economic immigrants looking for better lives. But a half million new Canadians a year is widely seen as irresponsible.
So why did Canada, along with so many other Western governments, choose to ignore their own electorates and instead double down on ever-increasing immigration rates? Whatever nasty insults we might be tempted to hurl at elected officials and the civil servants who (sometimes) do their bidding, I try to remember that many of them are smart people honestly struggling to be effective. Governing isn’t easy. So it’s worth cutting through the rhetoric and trying to understand their policies on their own terms.
The Audit is a reader-supported publication. To receive new posts and support my work, consider becoming a free or paid subscriber.
As recently as 2022, the government – as part of its Annual Report to Parliament on Immigration – claimed that:
“Immigration is critical to Canada’s economic growth, and is key to supporting economic recovery”
There you have it. It’s at least officially about the economy. To be fair, the report also argued that immigration was necessary to address labor shortages, support an aging domestic population, and keep up with our “international commitments”. But economic considerations carried a lot of weight.
Now what I’d love to know is whether the “immigration-equals-better-
One possible way to measure economic health is by watching per capita gross domestic product (GDP) growth rates. Insofar as they represent anything real, the inflation-adjusted GDP rates themselves are interesting enough. But it’s the rates by which GDP grows or contracts that should really capture our attention.
The green line in the graph below represents Canada’s (first quarter) GDP growth rates from the past forty years. To be clear, when measured against, say, its 1984 value, the GDP itself has trended upwards fairly consistently. But looking at changes from one year to the next makes it easier to visualize more detailed historical fluctuations.
The blue bars in the chart represent each year’s immigration numbers as a percentage of the total Canadian population. That rate leapt above one percent of the population in 2021 – for the first time since the 1960’s – and hasn’t shown any signs of backing down. Put differently, Canada absorbed nearly 12 immigrants in 2023 for every 1,000 existing residents.
Seeing both trends together in a single chart allows us to spot possible relationships. In particular, it seems that higher immigration rates (like the ones in 2018-2019 and 2022-2023) haven’t consistently sparked increases in the GDP.
With the exception of those COVID-crazed 2020 numbers – which are nutty outliers and are generally impossible to reliably incorporate into any narrative – there doesn’t ever seem to have been a correlation between higher immigration rates and significant GDP growth.
So, at best, there’s no indication that the fragile economy has benefited from that past decade’s immigration surge. As well-intentioned as it might have been, the experiment hasn’t been a success by any measure.
But it has come with some heavy social costs. The next chart shows the painful disconnect between an artificially rising population and a weak housing construction market. The blue bars, as before, represent immigration rates as a percentage of total population. This time, however, they go back all the way to 1961. The red line tells us about the number of single-detached housing starts per 1,000 people.
With the exceptions of the mid-1960’s and the past few years, each of the historical immigration surges visible in the graph was either preceded or accompanied by appropriate home construction rates.
As an anomaly, the 1960’s surge was for obvious reasons far less damaging. Back then you could still purchase a nice three-bedroom house in what’s now considered midtown Toronto for no more than two years’ worth of an average salary. I know that, because that’s exactly when, where, and for how much my parents bought the house in which I spent most of my errant youth. Those elevated immigration levels didn’t lead us into economic crisis.
But what we’re witnessing right now is different. The housing supply necessary to affordably keep us all sheltered simply doesn’t exist. And, as I’ve already written, there’s no reason to imagine that that’ll change anytime over the next decade. (Can you spell “capital gains tax inclusion rate change”? I knew you could.)
Just to be complete, the disconnect doesn’t apply only to detached “built-to-own” houses. This next chart demonstrates that housing starts of all flavours – including rental units – grew appropriately in the context of historical immigration surges, but have clearly been dropping over the last couple of years.
Since housing starts data isn’t the only tool for measuring the health of a housing market, here’s a visualization of rental apartment vacancy rates in Canada:
The combination of a sluggish construction market and an immigration-fueled population explosion has been driving up prices and making life miserable for countless families. And things appear to be headed in the wrong direction.
So sure, immigration should play an important role in Canadian life. But by this point in the game, it’s pretty clear that recent government policy choices failed to reverse economic weakness and contributed to disastrous outcomes. Perhaps it’s time to change course.
Now it’s your turn. I hope you’ll take this very brief (and anonymous) survey.
Share your thoughts. Click to take the Immigration Policy survey.
Assuming we get enough responses, I’ll share the results later.
2025 Federal Election
Highly touted policies the Liberal government didn’t actually implement

From The Audit
State capacity is the measure of a government’s ability to get stuff done that benefits its population. There are many ways to quantify state capacity, including GDP per capita spent on health, education, and infrastructure versus outcomes; the tax-to-GDP ratio; judicial independence; enforcement of contracts; and crime rates.
But a government’s ability to actually implement its own policies has got to rank pretty high here, too. All the best intentions are worthless if, as I wrote in the context of the Liberal’s 2023 national action plan to end gender-based violence, your legislation just won’t work in the real world.
The Audit is a reader-supported publication.
To receive new posts and support my work, consider becoming a free or paid subscriber.
So I thought I’d take a look at some examples of federal legislation from the past ten years that passed through Parliament but, for one reason or another, failed to do its job. We may agree or disagree with goals driving the various initiatives, but government’s failure to get the work done over and over again speaks to a striking lack of state capacity.
The 2018 Cannabis Act (Bill C-45). C-45 legalized recreational cannabis in Canada, with a larger goal of regulating production, distribution, and consumption while reducing illegal markets and protecting public health. However, research has shown that illegal sales persisted post-legalization due to high legal prices and taxation. Studies have also shown continued use among children despite regulations. And there are troubling indicators about the overall impact on public health.
The 2021 Canadian Net-Zero Emissions Accountability Act (Bill C-12). The legislation aimed to ensure Canada achieves net-zero greenhouse gas emissions by 2050 by setting five-year targets and requiring emissions reduction plans. However, critics argue it lacks enforceable mechanisms to guarantee results. A much-delayed progress report highlighted a lack of action and actual emissions reductions lagging far behind projections.
The First Nations Clean Water Act (Bill C-61) was introduced in late 2024 but, as of the recent dissolution of Parliament, not yet passed. This should be seen in the context of the Safe Drinking Water for First Nations Act (2013), which was repealed in 2021 after failing to deliver promised improvements in water quality due to inadequate funding and enforcement. The new bill aimed to address these shortcomings, but a decade and a half of inaction speaks to a special level of public impotence.
The 2019 Impact Assessment Act (Bill C-69). Passed in 2019, this legislation reformed environmental assessment processes for major projects. Many argue it failed to achieve its dual goals of streamlining approvals while enhancing environmental protection. Industry groups claim it created regulatory uncertainty (to put it mildly), while environmental groups argue it hasn’t adequately protected ecosystems. No one seems happy with this one.
The 2019 Firearms Act (Bill C-71). Parts of this firearms legislation were delayed in implementation, particularly the point-of-sale record keeping requirements for non-restricted firearms. Some provisions weren’t fully implemented until years after passage.
The 2013 First Nations Financial Transparency Act. – This legislation, while technically implemented, was not fully enforced after 2015 when the Liberal government stopped penalizing First Nations that didn’t comply with its financial disclosure requirements.
The 2019 National Housing Strategy Act. From the historical perspective of six years of hindsight, the law has manifestly failed to meaningfully address Canada’s housing affordability crisis. Housing prices and homelessness have continued their rise in major urban centers.
The 2019 Indigenous Languages Act (Bill C-91). Many Indigenous advocates have argued the funding and mechanisms have been insufficient to achieve its goal of revitalizing endangered Indigenous languages.
The 2007 Public Servants Disclosure Protection Act (PSDPA). Designed to protect whistleblowers within the federal public service, the PSDPA has been criticized for its ineffectiveness. During its first three years, the Office of the Public Sector Integrity Commissioner (OPSIC) astonishingly reported no findings of wrongdoing or reprisal, despite numerous submissions. A 2017 review by the Standing Committee on Government Operations and Estimates recommended significant reforms, but there’s been no visible progress.
There were, of course, many bills from the past ten years that were fully implemented.¹ But the failure rate is high enough that I’d argue it should be taken into account when measuring our state capacity.
Still, as a friend once noted, there’s a silver lining to all this: the one thing more frightening than an inefficient and ineffective government is an efficient and effective government. So there’s that.
The fact that we’re still living through the tail end of a massive bout of inflation provides clear testimony that Bill C-13 (COVID-19 Emergency Response Act) had an impact.
For the full experience, upgrade your subscription.
David Clinton
You’re Actually Voting for THEM? But why?

 By David Clinton
Putting the “dialog” back in dialog
I hate it when public figures suggest that serious issues require a “dialog” or a “conversation”. That’s because real dialog and real conversation involve bi-directional communication, which is something very few public figures seem ready to undertake. Still, it would be nice is there was some practical mechanism through which a conversation could happen.
It should be obvious – and I’m sure you’ll agree – that no intelligent individual will be voting in the coming federal election for any party besides the one I’ve chosen. And yet I’ve got a nagging sense that, inexplicably, many of you have other plans. Which, since only intelligent people read The Audit, leads me directly to an epistemological conflict.
I have my doubts about the prospects for meaningful leadership debates. Even if such events are being planned, they’ll probably produce more shouting and slogans than a useful comparison of policy positions.
And I have remarkably little patience for opinion polls. Even if they turn out to have been accurate, they tell us absolutely nothing about what Canadians actually want. Poll numbers may be valuable to party campaign planners, but there’s very little there for me.
If I can’t even visualize the thinking taking place in other camps, I’m missing a big part of Canada’s biggest story. And I really don’t like being left out.
So I decided to ask you for your thoughts. I’d love for each of you to take a super-simple, one question survey. I’m not really interested in how you’re planning to vote, but why. I’m asked for open-ended explanations that justify your choice. Will your vote be a protest against something you don’t like or an expression of your confidence in one particular party? Is it just one issue that’s pushing you to the polling station or a whole set?
I’d do this as a Substack survey, but the Substack platform associates way too much of your private information with the results. I really, really want this one to be truly anonymous.
And when I say this is a “super simple” survey, I mean it. To make sure that absolutely no personal data accompanies your answers (and to save me having to work harder), the survey page is a charming throwback to PHP code in all its 1996 glory.
So please do take the survey: theaudit.ca/voting.
If there are enough responses, I plan to share my analysis of patterns and trends through The Audit.
-
 2025 Federal Election1 day ago
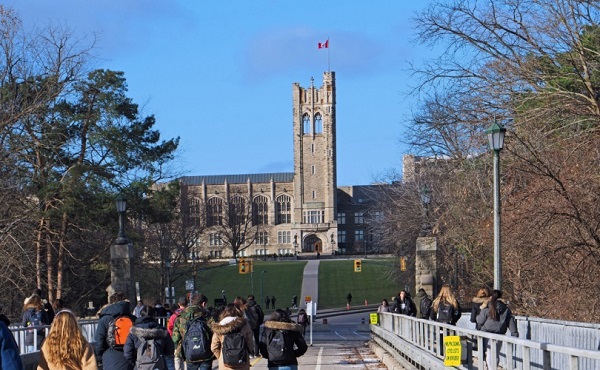
RCMP memo warns of Chinese interference on Canadian university campuses to affect election
-
 2025 Federal Election2 days ago
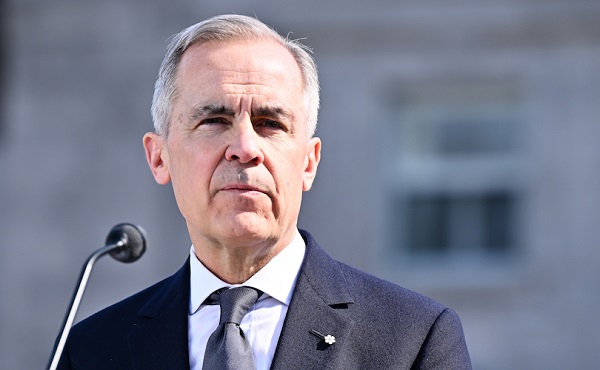
Conservative Party urges investigation into Carney plan to spend $1 billion on heat pumps
-

 Alberta1 day ago
Alberta takes big step towards shorter wait times and higher quality health care
-
 2025 Federal Election2 days ago
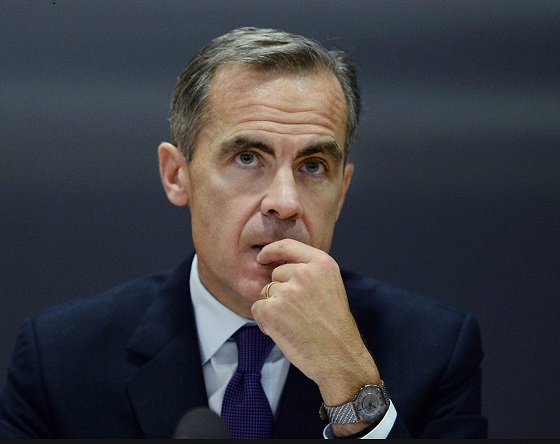
Fifty Shades of Mark Carney
-
 2025 Federal Election15 hours ago
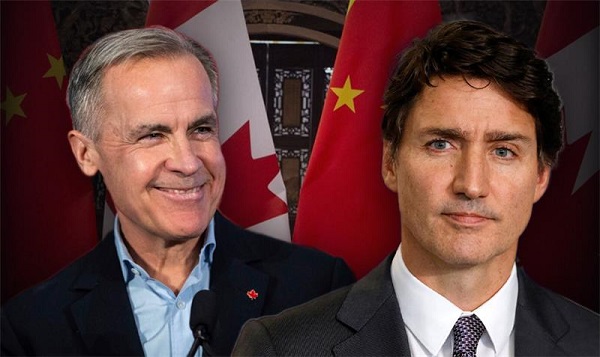
Researchers Link China’s Intelligence and Elite Influence Arms to B.C. Government, Liberal Party, and Trudeau-Appointed Senator
-

 2025 Federal Election2 days ago
Corporate Media Isn’t Reporting on Foreign Interference—It’s Covering for It
-
 Business1 day ago
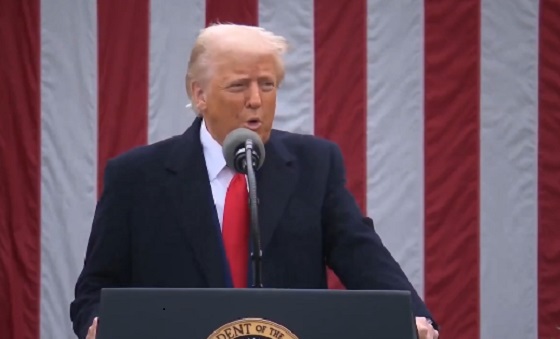
Trump raises China tariffs to 125%, announces 90-day pause for countries who’ve reached out to negotiate
-

 2025 Federal Election1 day ago
The status quo in Canadian politics isn’t sustainable for national unity


