Economy
Welcome to the Era of Energy Realism
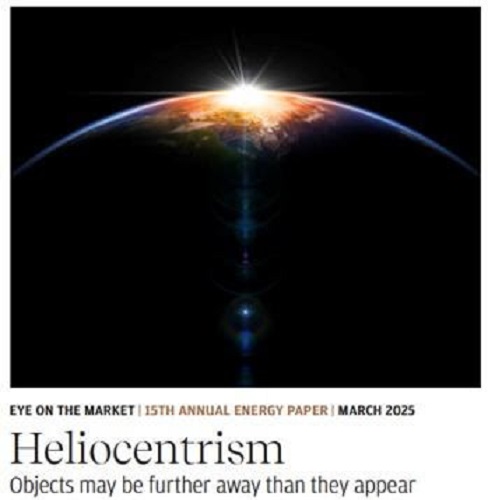
The Honest Broker  Roger Pielke Jr.
Every year for the past 15 years, JP Morgan publishes an outstanding annual energy report by Michael Cembalest. Last week JP Morgan published its 2025 edition and today I share five important figures from the many in the report, which I highly recommend.
Cembalest’s top line:
[A]fter $9 trillion globally over the last decade spent on wind, solar, electric vehicles, energy storage, electrified heat and power grids, the renewable transition is still a linear one; the renewable share of final energy consumption is slowly advancing at 0.3%–0.6% per year.
You can see that in the figure below — my graph using data from the 2024 EI Statistical Review of World Energy — which shows the proportion of global energy consumption from all carbon-free sources. Since 2012, that proportion has increased from about 14% to a bit over 18%. Exactly as Cembaest observes — that increase has been linear. At that rate of change the world would hit 100% carbon-free sometime after 2200.

Let’s take a look at some of the figures I found most interesting in the JP Morgan Report.
Solar Reality Check

“. . . when you boil it all down, solar power accounts for ~2% of global final energy consumption, a figure we expect to reach 4.5% by 2027. Even if these solar trends continue into the 2030’s, human prosperity will be inextricably linked to affordable natural gas and other fossil fuels for many years.
Human prosperity, in places where it thrives, relies heavily on steel, cement, ammonia/fertilizer, plastics, glass, chemicals and other industrial products which are energy- intensive to produce. . . these products currently rely on fossil fuels for 80%-85% of their energy.
And remember, prosperity itself is energy-intensive: among the tightest relationships in economics is the connection between a country’s per capita GDP and its per capita energy consumption.”
I remain very bullish on solar, but it won’t displace much fossil fuels anytime soon.
Electrify Everything is Proceeding Slowly

“Remember this key aspect of the energy transition: until an energy use is electrified, it’s hard to decarbonize it using green grid electrons. And while grid decarbonization is continuing at a steady pace, the US has made little progress increasing the electricity share of final energy consumption for the reasons discussed in last year’s “Electravision” piece. One major obstacle: transmission line growth is stuck in a rut, way below DoE targets for 2030 and 2035. Another obstacle: shortages of transformer equipment, whose delivery times have extended from 4-6 weeks in 2019 to 2-3 years. . . “
The panel on the rgiht above indicates that the U.S. was never going to meet the emissions reduction targets of the Biden Administration — which has been clear for several years now.

“The US is not unique with respect to the slow pace of electrification, although a few countries are making faster progress. Over the last decade China made the largest advance, bringing it in line with the OECD.
Part of the challenge may simply be the long useful lives of existing industrial plants, furnaces, boilers and vehicles. In other words, electrification might accelerate as their useful lives are exhausted. But the high cost of electricity compared to natural gas (particularly in places without a carbon tax) is another impediment to electrification that is not easy to solve since this ratio reflects relative total costs of production and distribution.”
(In order to coerce users, a carbon tax is necessary)
Energy Dependence and Independence

“The US has achieved US energy independence for the first time in 40 years while Europe and China compete for global energy resources. China’s imports are similar to Europe in energy terms but half as much as a share of domestic energy consumption. Energy intensive manufacturing has shifted to the developing world since the mid 1990’s. China is negotiating with Russia and Turkmenistan regarding future gas pipeline projects. China has the benefit of time: China gas imports are projected to reach 250 bcm by 2030 vs 170 bcm in 2023, almost all of which can be met by already contracted supplies. What was Taiwan thinking by shutting down nuclear power which has fallen from 50% to 5% of generation? Taiwan is now one of the most energy dependent countries in the world, resulting in rising economic costs if China were to impose a blockade.”
The Trump administration’s trade war with Canada risks upending North America’s energy dominance. What can they be thinking?
Fossil Fuels Falling and Rising

“Fossil fuel shares of final energy are falling faster in China, Japan and Europe than in the US. Growth in fossil fuel consumption is slowing but no clear sign of a peak on a global basis. Hydraulically fractured oil and gas account for 60%+ of US primary energy consumption. Global LNG export capacity is set to expand by one third by 2030. Coal consumption is roughly flat in final energy terms as rising EM consumption offsets falling OECD consumption.”
US Secretary of Energy Chris Wright spoke at an energy conference in Houston, and his remarks have been transcribed by Robert Bryce. Here is an excerpt:
Let’s do a quick survey of energy access today. Roughly one billion people live lives remotely recognizable to us in this room. We wear fancy clothes, mostly made out of hydrocarbons. We travel in motorized transport. The extra lucky of us fly across the world to attend conferences. We heat our homes in winter, cool them in summer, store myriad foods in our freezers and refrigerators, and have light, communications and entertainment at the flip of a switch.
Pretty awesome.
This lifestyle requires an average of 13 barrels of oil per person per year. What about the other seven billion people? They want what we have. The other seven billion people, on average, consume only three barrels of oil per person per year versus our 13. Africans average less than one barrel.
We need more energy. Lots more energy. That much should be obvious.
Read Wright’s speech alongside Cembalest’s energy analysis — We are at long last in an era of energy realism.
The Honest Broker
THB is reader supported.
Please consider a subscription or an upgrade to support work like that you just read.
From the Fraser Institute
According to a recent study, living standards in Canada have declined over the past five years. And the country’s economic growth has been “ugly.” Crucially, all 10 provinces are experiencing this economic stagnation—there are no exceptions to Canada’s “ugly” growth record. In 2026, reversing this trend should be the top priority for the Carney government and provincial governments across the country.
Indeed, demographic and economic data across the country tell a remarkably similar story over the past five years. While there has been some overall economic growth in almost every province, in many cases provincial populations, fuelled by record-high levels of immigration, have grown almost as quickly. Although the total amount of economic production and income has increased from coast to coast, there are more people to divide that income between. Therefore, after we account for inflation and population growth, the data show Canadians are not better off than they were before.
Let’s dive into the numbers (adjusted for inflation) for each province. In British Columbia, the economy has grown by 13.7 per cent over the past five years but the population has grown by 11.0 per cent, which means the vast majority of the increase in the size of the economy is likely due to population growth—not improvements in productivity or living standards. In fact, per-person GDP, a key indicator of living standards, averaged only 0.5 per cent per year over the last five years, which is a miserable result by historic standards.
A similar story holds in other provinces. Prince Edward Island, Nova Scotia, Quebec and Saskatchewan all experienced some economic growth over the past five years but their populations grew at almost exactly the same rate. As a result, living standards have barely budged. In the remaining provinces (Newfoundland and Labrador, New Brunswick, Ontario, Manitoba and Alberta), population growth has outstripped economic growth, which means that even though the economy grew, living standards actually declined.
This coast-to-coast stagnation of living standards is unique in Canadian history. Historically, there’s usually variation in economic performance across the country—when one region struggles, better performance elsewhere helps drive national economic growth. For example, in the early 2010s while the Ontario and Quebec economies recovered slowly from the 2008/09 recession, Alberta and other resource-rich provinces experienced much stronger growth. Over the past five years, however, there has not been a “good news” story anywhere in the country when it comes to per-person economic growth and living standards.
In reality, Canada’s recent record-high levels of immigration and population growth have helped mask the country’s economic weakness. With more people to buy and sell goods and services, the overall economy is growing but living standards have barely budged. To craft policies to help raise living standards for Canadian families, policymakers in Ottawa and every provincial capital should remove regulatory barriers, reduce taxes and responsibly manage government finances. This is the great policy challenge for governments across the country in 2026 and beyond.

Ben Eisen
Senior Fellow, Fraser Institute

Jake Fuss
Director, Fiscal Studies, Fraser Institute

From the Fraser Institute
The dawn of a new year is an opportune time to ponder the recent performance of Canada’s $3.4 trillion economy. And the overall picture is not exactly cheerful.
Since the start of 2025, our principal trading partner has been ruled by a president who seems determined to unravel the post-war global economic and security order that provided a stable and reassuring backdrop for smaller countries such as Canada. Whether the Canada-U.S.-Mexico trade agreement (that President Trump himself pushed for) will even survive is unclear, underscoring the uncertainty that continues to weigh on business investment in Canada.
At the same time, Europe—representing one-fifth of the global economy—remains sluggish, thanks to Russia’s relentless war of choice against Ukraine, high energy costs across much of the region, and the bloc’s waning competitiveness. The huge Chinese economy has also lost a step. None of this is good for Canada.
Yet despite a difficult external environment, Canada’s economy has been surprisingly resilient. Gross domestic product (GDP) is projected to grow by 1.7 per cent (after inflation) this year. The main reason is continued gains in consumer spending, which accounts for more than three-fifths of all economic activity. After stripping out inflation, money spent by Canadians on goods and services is set to climb by 2.2 per cent in 2025, matching last year’s pace. Solid consumer spending has helped offset the impact of dwindling exports, sluggish business investment and—since 2023—lacklustre housing markets.
Another reason why we have avoided a sharper economic downturn is that the Trump administration has, so far, exempted most of Canada’s southbound exports from the president’s tariff barrage. This has partially cushioned the decline in Canada’s exports—particularly outside of the steel, aluminum, lumber and auto sectors, where steep U.S. tariffs are in effect. While exports will be lower in 2025 than the year before, the fall is less dramatic than analysts expected 6 to 8 months ago.
Although Canada’s economy grew in 2025, the job market lost steam. Employment growth has softened and the unemployment rate has ticked higher—it’s on track to average almost 7 per cent this year, up from 5.4 per cent two years ago. Unemployment among young people has skyrocketed. With the economy showing little momentum, employment growth will remain muted next year.
Unfortunately, there’s nothing positive to report on the investment front. Adjusted for inflation, private-sector capital spending has been on a downward trajectory for the last decade—a long-term trend that can’t be explained by Trump’s tariffs. Canada has underperformed both the United States and several other advanced economies in the amount of investment per employee. The investment gap with the U.S. has widened steadily since 2014. This means Canadian workers have fewer and less up-to-date tools, equipment and technology to help them produce goods and services compared to their counterparts in the U.S. (and many other countries). As a result, productivity growth in Canada has been lackluster, narrowing the scope for wage increases.
Preliminary data indicate that both overall non-residential investment and business capital spending on machinery, equipment and advanced technology products will be down again in 2025. Getting clarity on the future of the Canada-U.S. trade relationship will be key to improving the business environment for private-sector investment. Tax and regulatory policy changes that make Canada a more attractive choice for companies looking to invest and grow are also necessary. This is where government policymakers should direct their attention in 2026.


Why Japan wants Western Canadian LNG

Disclosures reveal Minnesota politician’s husband’s companies surged thousands-fold amid Somali fraud crisis

What Do Loyalty Rewards Programs Cost Us?

Mainstream media missing in action as YouTuber blows lid off massive taxpayer fraud
-
 Business16 hours ago
How convenient: Minnesota day care reports break-in, records gone
-
 International16 hours ago
Trump confirms first American land strike against Venezuelan narco networks
-
 Business2 days ago
The Real Reason Canada’s Health Care System Is Failing
-
 Opinion1 day ago
Globally, 2025 had one of the lowest annual death rates from extreme weather in history
-
Business15 hours ago
The great policy challenge for governments in Canada in 2026
-
 Business2 days ago
Federal funds FROZEN after massive fraud uncovered: Trump cuts off Minnesota child care money
-
 Addictions2 days ago
Coffee, Nicotine, and the Politics of Acceptable Addiction
-
Business2 days ago
Dark clouds loom over Canada’s economy in 2026