National
Medical Assistance in Dying now accounts for over 4% of deaths in Canada
The following are interesting statistics pulled directly from the:
Fourth annual report on Medical Assistance in Dying in Canada 2022
Growth in the number of medically assisted deaths in Canada continues in 2022.
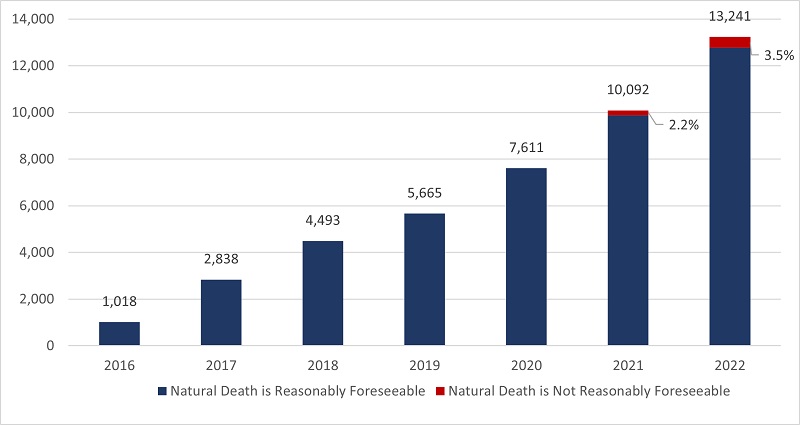
- In 2022, there were 13,241 MAID provisions reported in Canada, accounting for 4.1% of all deaths in Canada.
- The number of cases of MAID in 2022 represents a growth rate of 31.2% over 2021. All provinces except Manitoba and the Yukon continue to experience a steady year-over-year growth in 2022.
- When all data sources are considered, the total number of medically assisted deaths reported in Canada since the introduction of federal MAID legislation in 2016 is 44,958.
Profile of MAID recipients
- In 2022, a slightly larger proportion of males (51.4%) than females (48.6%) received MAID. This result is consistent with 2021 (52.3% males and 47.7% females), 2020 (51.9% males and 48.1% females) and 2019 (50.9% males and 49.1% females).
- The average age of individuals at the time MAID was provided in 2022 was 77.0 years. This average age is slightly higher than the averages of 2019 (75.2), 2020 (75.3) and 2021 (76.3). The average age of females during 2022 was 77.9, compared to males at 76.1.
- Cancer (63.0%) is the most cited underlying medical condition among MAID provisions in 2022, down from 65.6% in 2021 and from a high of 69.1% in 2020. This is followed by cardiovascular conditions (18.8%), other conditions (14.9%), respiratory conditions (13.2%) and neurological conditions (12.6%).
- In 2022, 3.5% of the total number of MAID provisions (463 individuals), were individuals whose natural deaths were not reasonably foreseeable. This is an increase from 2.2% in 2021 (223 individuals). The most cited underlying medical condition for this population was neurological (50.0%), followed by other conditions (37.1%), and multiple comorbidities (23.5%), which is similar to 2021 results. The average age of individuals receiving MAID whose natural death was not reasonably foreseeable was 73.1 years, slightly higher than 70.1 in 2021 but lower than the average age of 77.0 for all MAID recipients in 2022.
Nature of suffering among MAID recipients
- In 2022, the most commonly cited sources of suffering by individuals requesting MAID were the loss of ability to engage in meaningful activities (86.3%), followed by loss of ability to perform activities of daily living (81.9%) and inadequate control of pain, or concern about controlling pain (59.2%).
- These results continue to mirror very similar trends seen in the previous three years (2019 to 2021), indicating that the nature of suffering that leads a person to request MAID has remained consistent over the past four years.
Eligibility Criteria
- Request MAID voluntarily
- 18 years of age or older
- Capacity to make health care decisions
- Must provide informed consent
- Eligible for publicly funded health care services in Canada
- Diagnosed with a “grievous and irremediable medical condition,” where a person must meet all of the following criteria:
- serious and incurable illness, disease or disability
- advanced state of irreversible decline in capability,
- experiencing enduring physical or psychological suffering that is caused by their illness, disease or disability or by the advanced state of decline in capability, that is intolerable to them and that cannot be relieved under conditions that they consider acceptable
- Mental Illness as sole underlying medical condition is excluded until March 17, 2024
3.1 Number of Reported MAID Deaths in Canada (2016 to 2022)
2022 marks six and a half years of access to MAID in Canada. In 2022, there were 13,241 MAID provisions in Canada, bringing the total number of medically assisted deaths in Canada since 2016 to 44,958. In 2022, the total number of MAID provisions increased by 31.2% (2022 over 2021) compared to 32.6% (2021 over 2020). The annual growth rate in MAID provisions has been steady over the past six years, with an average growth rate of 31.1% from 2019 to 2022.

Access to MAID for individuals whose deaths were not reasonably foreseeable marked its second year of eligibility in 2022. In Canada, eligibility for individuals whose death is not reasonably foreseeable began on March 17, 2021, after the passage of the new legislation.Footnote8 There were 463 MAID provisions for persons whose natural death was not reasonably foreseeable, representing 3.5% of all MAID deaths in 2022. This is just over twice the total number of provisions for individuals where natural death was not reasonably foreseeable in 2021 (223 provisions representing 2.2% of all MAID provisions in 2021). Table 3.1 represents total MAID provisions in Canada from 2016 to 2022, including provisions for individuals where natural death was not reasonably foreseeable.
All jurisdictions, except Manitoba and Yukon, experienced growth in MAID provisions in 2022. The highest percentage year over year increases occurred in Québec (45.5%), Alberta (40.7%), Newfoundland and Labrador (38.5%), Ontario (26.8%) and British Columbia (23.9%). Nova Scotia (11.8%), Prince Edward Island (7.3%) and Saskatchewan (4.0%) had lower growth rates. The Yukon remained at the same level as 2021, while Manitoba was the only jurisdiction to experience a decline in MAID provisions for 2022 (-9.0%).
| MAID | NL | PE | NS | NB | QC | ON | MB | SK | AB | BC | YT | NT | NU | Canada |
|---|---|---|---|---|---|---|---|---|---|---|---|---|---|---|
| 2016 | – | – | 24 | 9 | 494 | 191 | 24 | 11 | 63 | 194 | – | – | – | 1,018 |
| 2017 | – | – | 62 | 49 | 853 | 839 | 63 | 57 | 205 | 677 | – | – | – | 2,838 |
| 2018 | 23 | 8 | 126 | 92 | 1,249 | 1,500 | 138 | 85 | 307 | 951 | 12 | – | – | 4,493 |
| 2019 | 20 | 20 | 147 | 141 | 1,604 | 1,788 | 177 | 97 | 377 | 1,280 | 13 | – | – | 5,665 |
| 2020 | 49 | 37 | 190 | 160 | 2,278 | 2,378 | 214 | 160 | 555 | 1,572 | 13 | – | – | 7,611 |
| 2021 | 65 | 41 | 245 | 205 | 3,299 | 3,102 | 245 | 247 | 594 | 2,030 | 16 | – | – | 10,092 |
| 2022 | 90 | 44 | 274 | 247 | 4,801 | 3,934 | 223 | 257 | 836 | 2,515 | 16 | – | – | 13,241 |
| TOTAL 2016-2022 |
267 | 156 | 1,068 | 903 | 14,578 | 13,732 | 1,084 | 914 | 2,937 | 9,219 | 84 | – | – | 44,958 |
3.2 MAID Deaths as a Proportion of Total Deaths in Canada
MAID deaths accounted for 4.1% of all deaths in Canada in 2022, an increase from 3.3% in 2021, 2.5% in 2020 and 2.0% in 2019. In 2022, six jurisdictions continue to experience increases in the number of MAID provisions as a percentage of total deaths, ranging from a low of 1.5% (Newfoundland & Labrador) to a high of 6.6% (Québec). MAID deaths as a percentage of total deaths remained at the same levels as 2021 for Prince Edward Island, Nova Scotia, and Saskatchewan, while Manitoba experienced a decline in MAID deaths as a percentage of all deaths (from 2.1% in 2021 to 1.8% in 2022). As with each of the three previous years (2019 to 2021), Québec and British Columbia experienced the highest percentage of MAID deaths as a proportion of all deaths within their jurisdiction in 2022 (6.6% and 5.5% respectively), continuing to reflect the socio-political dynamics of these two jurisdictions in the context of MAID.
4.5 Profile of Persons Receiving MAID Whose Natural Death is not Reasonably Foreseeable
2022 marks the second year that MAID for persons whose natural death is not reasonably foreseeable is permitted under the law if all other eligibility criteria are met (Table 1.1). New federal MAID legislation passed on March 17, 2021, created a two-track approach to procedural safeguards for MAID practitioners to follow, based on whether or not a person’s natural death is reasonably foreseeable. This approach to safeguards ensures that sufficient time and expertise are spent assessing MAID requests from persons whose natural death is not reasonably foreseeable. New and enhanced safeguards (Table 1.2), including a minimum 90-day assessment period, seek to address the diverse source of suffering and vulnerability that could potentially lead a person who is not nearing death to ask for MAID and to identify alternatives to MAID that could reduce suffering.
In 2022, 3.5% of MAID recipients (463 individuals) were assessed as not having a reasonably foreseeable natural death, up slightly from 2.2% (223 individuals) in 2021. As a percentage of all MAID deaths in Canada, MAID for individuals whose natural death is not reasonably foreseeable represents just 0.14% of all deaths in Canada in 2022 (compared to all MAID provisions, which represent 4.1% of all 2022 deaths in Canada). The proportion of MAID recipients whose natural death was not reasonably foreseeable continues to remain very small compared to the total number of MAID recipients.
This population of individuals whose natural death was not reasonably foreseeable have a different medical profile than individuals whose death was reasonably foreseeable. As shown in Chart 4.5A, the main underlying medical condition reported in the population whose natural death was not reasonably foreseeable was neurological (50.0%), followed by ‘other condition’ (37.1%), and multiple comorbidities (23.5%). This differs from the main condition (as reported in Chart 4.1A) for all MAID recipients in 2022, where the majority of persons receiving MAID had cancer as a main underlying medical condition (63.0%), followed by cardiovascular conditions (18.8%) and other conditions (14.9%) (such as chronic pain, osteoarthritis, frailty, fibromyalgia, autoimmune conditions). These results are similar to 2021.

Of the MAID provisions for individuals where death was reasonably foreseeable, the majority were individuals ages 71 and older (71.1%) while only 28.9% were between ages 18-70. A similar trend was observed for individuals where natural death was not reasonably foreseeable which also showed a greater percentage of individuals who received MAID being 71 and older (58.5%) and a lower number of MAID provisions for individuals between 18-70 years (41.5%). Overall, however, MAID provisions for individuals whose death is not reasonably foreseeable tended to be in the younger age categories than those where natural death is foreseeable.


From the Frontier Centre for Public Policy
By Conrad Eder
Conrad Eder supports universal health care, but not Canada’s broken version. Despite massive spending, Canadians face brutal wait times. He argues it’s time to allow private options, as other countries do, without abandoning universality.
It’s not about money. It’s about the rules shaping how Canada’s health care system works
Canada’s health care system isn’t failing because it lacks funding or public support. It’s failing because governments have tied it to restrictive rules that block private medical options used in other developed countries to deliver timely care.
Canada spends close to $400 billion a year on health care, placing it among the highest-spending countries in the Organization for Economic Co-operation and Development (OECD). Yet the system continues to struggle with some of the longest waits for care, the fewest doctors per capita and among the lowest numbers of hospital beds in the OECD. This is despite decades of spending increases, including growth of 4.5 per cent in 2023 and 5.7 per cent in 2024, according to estimates from the Canadian Institute for Health Information.
Canadians are losing confidence that government spending is the solution. In fact, many don’t even think it’s making a difference.
And who could blame them? Median health care wait times reached 30 weeks in 2024, up from 27.7 weeks in 2023, which was up from 27.4 weeks in 2022, according to annual surveys by the Fraser Institute.
Nevertheless, politicians continue to tout our universal health care system as a source of national pride and, according to national surveys, 74 per cent of Canadians agree. Yet only 56 per cent are satisfied with it. This gap reveals that while Canadians value universal health care in principle, they are frustrated with it in practice.
But it isn’t universal health care that’s the problem; it’s Canada’s uniquely restrictive version of it. In most provinces, laws restrict physicians from working simultaneously in public and private systems and prohibit private insurance for medically necessary services covered by medicare, constraints that do not exist in most other universal health care systems.
The United Kingdom, France, Germany and the Netherlands all maintain universal health care systems. Like Canada, they guarantee comprehensive insurance coverage for essential health care services. Yet they achieve better access to care than Canada, with patients seeing doctors sooner and benefiting from shorter surgical wait times.
In Germany, there are both public and private hospitals. In France, universal insurance covers procedures whether patients receive them in public hospitals or private clinics. In the Netherlands, all health insurance is private, with companies competing for customers while coverage remains guaranteed. In the United Kingdom, doctors working in public hospitals are allowed to maintain private practices.
All of these countries preserved their commitment to universal health care while allowing private alternatives to expand choice, absorb demand and deliver better access to care for everyone.
Only 26 per cent of Canadians can get same-day or next-day appointments with their family doctor, compared to 54 per cent of Dutch and 47 per cent of English patients. When specialist care is needed, 61 per cent of Canadians wait more than a month, compared to 25 per cent of Germans. For elective surgery, 90 per cent of French patients undergo procedures within four months, compared to 62 per cent of Canadians.
If other nations can deliver timely access to care while preserving universal coverage, so can Canada. Two changes, inspired by our peers, would preserve universal coverage and improve access for all.
First, allow physicians to provide services to patients in both public and private settings. This flexibility incentivizes doctors to maximize the time they spend providing patient care, expanding service capacity and reducing wait times for all patients. Those in the public system benefit from increased physician availability, as private options absorb demand that would otherwise strain public resources.
Second, permit private insurance for medically necessary services. This would allow Canadians to obtain coverage for private medical services, giving patients an affordable way to access health care options that best suit their needs. Private insurance would enable Canadians to customize their health coverage, empowering patients and supporting a more responsive health care system.
These proposals may seem radical to Canadians. They are not. They are standard practice everywhere else. And across the OECD, they coexist with universal health care. They can do the same in Canada.
Alberta has taken an important first step by allowing some physicians to work simultaneously in public and private settings through its new dual-practice model. More Canadian provinces should follow Alberta’s lead and go one step further by removing legislative barriers that prohibit private health insurance for medically necessary services. Private insurance is the natural complement to dual practice, transforming private health care from an exclusive luxury into a viable option for Canadian families.
Canadians take pride in their health care system. That pride should inspire reform, not prevent it. Canada’s health care crisis is real. It’s a crisis of self-imposed constraints preventing our universal system from functioning at the level Canadians deserve.
Policymakers can, and should, preserve universal health care in this country. But maintaining it will require a willingness to learn from those who have built systems that deliver universality and timely access to care, something Canada’s current system does not.
Conrad Eder is a policy analyst at the Frontier Centre for Public Policy.

From the Fraser Institute
The dawn of a new year is an opportune time to ponder the recent performance of Canada’s $3.4 trillion economy. And the overall picture is not exactly cheerful.
Since the start of 2025, our principal trading partner has been ruled by a president who seems determined to unravel the post-war global economic and security order that provided a stable and reassuring backdrop for smaller countries such as Canada. Whether the Canada-U.S.-Mexico trade agreement (that President Trump himself pushed for) will even survive is unclear, underscoring the uncertainty that continues to weigh on business investment in Canada.
At the same time, Europe—representing one-fifth of the global economy—remains sluggish, thanks to Russia’s relentless war of choice against Ukraine, high energy costs across much of the region, and the bloc’s waning competitiveness. The huge Chinese economy has also lost a step. None of this is good for Canada.
Yet despite a difficult external environment, Canada’s economy has been surprisingly resilient. Gross domestic product (GDP) is projected to grow by 1.7 per cent (after inflation) this year. The main reason is continued gains in consumer spending, which accounts for more than three-fifths of all economic activity. After stripping out inflation, money spent by Canadians on goods and services is set to climb by 2.2 per cent in 2025, matching last year’s pace. Solid consumer spending has helped offset the impact of dwindling exports, sluggish business investment and—since 2023—lacklustre housing markets.
Another reason why we have avoided a sharper economic downturn is that the Trump administration has, so far, exempted most of Canada’s southbound exports from the president’s tariff barrage. This has partially cushioned the decline in Canada’s exports—particularly outside of the steel, aluminum, lumber and auto sectors, where steep U.S. tariffs are in effect. While exports will be lower in 2025 than the year before, the fall is less dramatic than analysts expected 6 to 8 months ago.
Although Canada’s economy grew in 2025, the job market lost steam. Employment growth has softened and the unemployment rate has ticked higher—it’s on track to average almost 7 per cent this year, up from 5.4 per cent two years ago. Unemployment among young people has skyrocketed. With the economy showing little momentum, employment growth will remain muted next year.
Unfortunately, there’s nothing positive to report on the investment front. Adjusted for inflation, private-sector capital spending has been on a downward trajectory for the last decade—a long-term trend that can’t be explained by Trump’s tariffs. Canada has underperformed both the United States and several other advanced economies in the amount of investment per employee. The investment gap with the U.S. has widened steadily since 2014. This means Canadian workers have fewer and less up-to-date tools, equipment and technology to help them produce goods and services compared to their counterparts in the U.S. (and many other countries). As a result, productivity growth in Canada has been lackluster, narrowing the scope for wage increases.
Preliminary data indicate that both overall non-residential investment and business capital spending on machinery, equipment and advanced technology products will be down again in 2025. Getting clarity on the future of the Canada-U.S. trade relationship will be key to improving the business environment for private-sector investment. Tax and regulatory policy changes that make Canada a more attractive choice for companies looking to invest and grow are also necessary. This is where government policymakers should direct their attention in 2026.


Largest fraud in US history? Independent Journalist visits numerous daycare centres with no children, revealing massive scam

Why Japan wants Western Canadian LNG

“Magnitude cannot be overstated”: Minnesota aid scam may reach $9 billion

Disclosures reveal Minnesota politician’s husband’s companies surged thousands-fold amid Somali fraud crisis
-
Business2 days ago
Disclosures reveal Minnesota politician’s husband’s companies surged thousands-fold amid Somali fraud crisis
-
 Alberta2 days ago
The Canadian Energy Centre’s biggest stories of 2025
-
 Business2 days ago
Resurfaced Video Shows How Somali Scammers Used Day Care Centers To Scam State
-
Business19 hours ago
The Real Reason Canada’s Health Care System Is Failing
-
 Business2 days ago
Minneapolis day care filmed empty suddenly fills with kids
-
 Business2 days ago
Ottawa Is Still Dodging The China Interference Threat
-
Business18 hours ago
Federal funds FROZEN after massive fraud uncovered: Trump cuts off Minnesota child care money
-
 Opinion10 hours ago
Globally, 2025 had one of the lowest annual death rates from extreme weather in history