Fraser Institute
Here’s your annual bill for public health care

From the Fraser Institute
Notably, the amount paid by the average family has increased by 239.7 per cent since 1997 (the first year of available data).
According to a recent survey by Statistics Canada, almost half of Canadians said that rising prices are affecting their ability to meet day-to-day expenses. At the same time, Canadians are increasingly aware of their significant tax burden, with 74 per cent feeling the average family is overtaxed. This is not surprising given the average Canadian family spends more on taxes than food, clothing and shelter combined.
However, one contributor to this growing tax burden remains hidden—the price we pay public health care. You read that right. Public health care is not free—but it’s very difficult to figure out exactly how much we pay for it on an individual or family basis.
This is primarily because our public health-care system is funded through general government revenues. In other words, there’s no dedicated tax that fully funds the system. Our income taxes, sales taxes, business taxes and other taxes get poured into a fiscal vat, from which governments take a generous portion for health care.
While it’s easy enough to gauge total health-care spending by governments ($225.1 billion) or how much was spent per Canadian ($5,614), it remains nearly impossible for Canadian families of different sizes and incomes to calculate how much they contribute towards that vast amount.
But a recent study helps us get a general idea. According to the study, an average family of four (two parents and two children) with an average income of $176,266 will pay an estimated $17,713 (in taxes) for public health care this year. Single Canadians, with an average income of $55,925, will pay $5,629. Of course, these amounts vary by income with the poorest 10 per cent of income earners paying $639 while the top 10 per cent pay $47,071.
Notably, the amount paid by the average family has increased by 239.7 per cent since 1997 (the first year of available data). This increase is 3.1 times greater than the rate of inflation, 2.2 times greater than food cost increases, and 1.6 times greater than housing costs increases. And crucially, the cost of public health care for the average family has increased 1.7 times faster than their average incomes grew during the same period.
These figures are not only important for families who are interested in how their tax dollars are spent, they are one very important side of the equation when trying to understand whether we receive good value for our health-care dollars. Moreover, as politicians continue to promise ever increasing health-care spending to fix our crumbling system, it’s crucial for Canadians to understand exactly how that spending impacts their wallets.
One thing is clear. With nearly an $18,000 price tag for the average family of four, Canada’s public health-care system is anything but free.
Author:
Business
Tariff-driven increase of U.S. manufacturing investment would face dearth of workers

From the Fraser Institute
Since 2015, the number of American manufacturing jobs has actually risen modestly. However, as a share of total U.S. employment, manufacturing has dropped from 30 per cent in the 1970s to around 8 per cent in 2024.
Donald Trump has long been convinced that the United States must revitalize its manufacturing sector, having—unwisely, in his view—allowed other countries to sell all manner of foreign-produced manufactured goods in the giant American market. As president, he’s moved quickly to shift the U.S. away from its previous embrace of liberal trade and open markets as cornerstones of its approach to international economic policy —wielding tariffs as his key policy instrument. Since taking office barely two months ago, President Trump has implemented a series of tariff hikes aimed at China and foreign producers of steel and aluminum—important categories of traded manufactured goods—and threatened to impose steep tariffs on most U.S. imports from Canada, Mexico and the European Union. In addition, he’s pledged to levy separate tariffs on imports of automobiles, semi-conductors, lumber, and pharmaceuticals, among other manufactured goods.
In the third week of March, the White House issued a flurry of news releases touting the administration’s commitment to “position the U.S. as a global superpower in manufacturing” and listing substantial new investments planned by multinational enterprises involved in manufacturing. Some of these appear to contemplate relocating manufacturing production in other jurisdictions to the U.S., while others promise new “greenfield” investments in a variety of manufacturing industries.
President Trump’s intense focus on manufacturing is shared by a large slice of America’s political class, spanning both of the main political parties. Yet American manufacturing has hardly withered away in the last few decades. The value of U.S. manufacturing “output” has continued to climb, reaching almost $3 trillion last year (equal to 10 per cent of total GDP). The U.S. still accounts for 15 per cent of global manufacturing production, measured in value-added terms. In fact, among the 10 largest manufacturing countries, it ranks second in manufacturing value-added on a per-capita basis. True, China has become the world’s biggest manufacturing country, representing about 30 per cent of global output. And the heavy reliance of Western economies on China in some segments of manufacturing does give rise to legitimate national security concerns. But the bulk of international trade in manufactured products does not involve goods or technologies that are particularly critical to national security, even if President Trump claims otherwise. Moreover, in the case of the U.S., a majority of two-way trade in manufacturing still takes place with other advanced Western economies (and Mexico).
In the U.S. political arena, much of the debate over manufacturing centres on jobs. And there’s no doubt that employment in the sector has fallen markedly over time, particularly from the early 1990s to the mid-2010s (see table below). Since 2015, the number of American manufacturing jobs has actually risen modestly. However, as a share of total U.S. employment, manufacturing has dropped from 30 per cent in the 1970s to around 8 per cent in 2024.
| U.S. Manufacturing Employment, Select Years (000)* | |
|---|---|
| 1990 | 17,395 |
| 2005 | 14,189 |
| 2010 | 14,444 |
| 2015 | 12,333 |
| 2022 | 12,889 |
| 2024 | 12,760 |
| *December for each year shown. Source: U.S. Bureau of Labor Statistics | |
Economists who have studied the trend conclude that the main factors behind the decline of manufacturing employment include continuous automation, significant gains in productivity across much of the sector, and shifts in aggregate demand and consumption away from goods and toward services. Trade policy has also played a part, notably China’s entry into the World Trade Organization (WTO) in 2001 and the subsequent dramatic expansion of its role in global manufacturing supply chains.
Contrary to what President Trump suggests, manufacturing’s shrinking place in the overall economy is not a uniquely American phenomenon. As Harvard economist Robert Lawrence recently observed “the employment share of manufacturing is declining in mature economies regardless of their overall industrial policy approaches. The trend is apparent both in economies that have adopted free-market policies… and in those with interventionist policies… All of the evidence points to deep and powerful forces that drive the long-term decline in manufacturing’s share of jobs and GDP as countries become richer.”
This brings us back to the president’s seeming determination to rapidly ramp up manufacturing investment and production as a core element of his “America First” program. An important issue overlooked by the administration is where to find the workers to staff a resurgent U.S. manufacturing sector. For while manufacturing has become a notably “capital-intensive” part of the U.S. economy, workers are still needed. And today, it’s hard to see where they will be found. This is especially true given the Trump administration’s well-advertised skepticism about the benefits of immigration.
According to the U.S. Bureau of Labor Statistics, the current unemployment rate across America’s manufacturing industries collectively stands at a record low 2.9 per cent, well below the economy-wide rate of 4.5 per cent. In a recent survey by the National Association of Manufacturers, almost 70 per cent of American manufacturers cited the inability to attract and retain qualified employees as the number one barrier to business growth. A cursory look at the leading industry trade journals confirms that skill and talent shortages remain persistent in many parts of U.S. manufacturing—and that shortages are destined to get worse amid the expected significant jump in manufacturing investment being sought by the Trump administration.
As often seems to be the case with Trump’s stated policy objectives, the math surrounding his manufacturing agenda doesn’t add up. Manufacturing in America is in far better shape than the president acknowledges. And a tariff-driven avalanche of manufacturing investment—should one occur—will soon find the sector reeling from an unprecedented human resource crisis.
Jock Finlayson
Senior Fellow, Fraser Institut
2025 Federal Election
Next federal government should recognize Alberta’s important role in the federation
From the Fraser Institute
By Tegan Hill
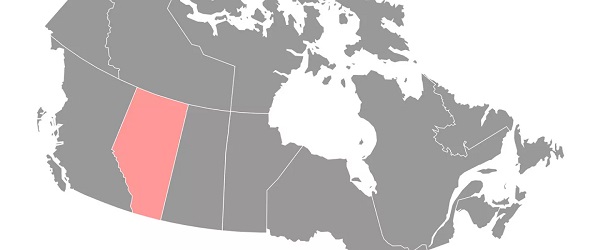
With the tariff war continuing and the federal election underway, Canadians should understand what the last federal government seemingly did not—a strong Alberta makes for a stronger Canada.
And yet, current federal policies disproportionately and negatively impact the province. The list includes Bill C-69 (which imposes complex, uncertain and onerous review requirements on major energy projects), Bill C-48 (which bans large oil tankers off British Columbia’s northern coast and limits access to Asian markets), an arbitrary cap on oil and gas emissions, numerous other “net-zero” targets, and so on.
Meanwhile, Albertans contribute significantly more to federal revenues and national programs than they receive back in spending on transfers and programs including the Canada Pension Plan (CPP) because Alberta has relatively high rates of employment, higher average incomes and a younger population.
For instance, since 1976 Alberta’s employment rate (the number of employed people as a share of the population 15 years of age and over) has averaged 67.4 per cent compared to 59.7 per cent in the rest of Canada, and annual market income (including employment and investment income) has exceeded that in the other provinces by $10,918 (on average).
As a result, Alberta’s total net contribution to federal finances (total federal taxes and payments paid by Albertans minus federal money spent or transferred to Albertans) was $244.6 billion from 2007 to 2022—more than five times as much as the net contribution from British Columbians or Ontarians. That’s a massive outsized contribution given Alberta’s population, which is smaller than B.C. and much smaller than Ontario.
Albertans’ net contribution to the CPP is particularly significant. From 1981 to 2022, Alberta workers contributed 14.4 per cent (on average) of total CPP payments paid to retirees in Canada while retirees in the province received only 10.0 per cent of the payments. Albertans made a cumulative net contribution to the CPP (the difference between total CPP contributions made by Albertans and CPP benefits paid to retirees in Alberta) of $53.6 billion over the period—approximately six times greater than the net contribution of B.C., the only other net contributing province to the CPP. Indeed, only two of the nine provinces that participate in the CPP contribute more in payroll taxes to the program than their residents receive back in benefits.
So what would happen if Alberta withdrew from the CPP?
For starters, the basic CPP contribution rate of 9.9 per cent (typically deducted from our paycheques) for Canadians outside Alberta (excluding Quebec) would have to increase for the program to remain sustainable. For a new standalone plan in Alberta, the rate would likely be lower, with estimates ranging from 5.85 per cent to 8.2 per cent. In other words, based on these estimates, if Alberta withdrew from the CPP, Alberta workers could receive the same retirement benefits but at a lower cost (i.e. lower payroll tax) than other Canadians while the payroll tax would have to increase for the rest of the country while the benefits remained the same.
Finally, despite any claims to the contrary, according to Statistics Canada, Alberta’s demographic advantage, which fuels its outsized contribution to the CPP, will only widen in the years ahead. Alberta will likely maintain relatively high employment rates and continue to welcome workers from across Canada and around the world. And considering Alberta recorded the highest average inflation-adjusted economic growth in Canada since 1981, with Albertans’ inflation-adjusted market income exceeding the average of the other provinces every year since 1971, Albertans will likely continue to pay an outsized portion for the CPP. Of course, the idea for Alberta to withdraw from the CPP and create its own provincial plan isn’t new. In 2001, several notable public figures, including Stephen Harper, wrote the famous Alberta “firewall” letter suggesting the province should take control of its future after being marginalized by the federal government.
The next federal government—whoever that may be—should understand Alberta’s crucial role in the federation. For a stronger Canada, especially during uncertain times, Ottawa should support a strong Alberta including its energy industry.
-
 Uncategorized9 hours ago
Poilievre on 2025 Election Interference – Carney sill hasn’t fired Liberal MP in Chinese election interference scandal
-

 Business19 hours ago
Cuba has lost 24% of it’s population to emigration in the last 4 years
-

 Business2 days ago
Labor Department cancels “America Last” spending spree spanning five continents
-

 2025 Federal Election2 days ago
Canadian Banks Tied to Chinese Fentanyl Laundering Risk U.S. Treasury Sanctions After Cartel Terror Designation
-

 Health2 days ago
RFK Jr. says ‘everything is going to change’ with CDC vaccine policy in Michael Knowles interview
-

 Automotive2 days ago
Trump warns U.S. automakers: Do not raise prices in response to tariffs
-

 2025 Federal Election2 days ago
Next federal government should recognize Alberta’s important role in the federation
-

 Business1 day ago
Tariff-driven increase of U.S. manufacturing investment would face dearth of workers


