Alberta
Activity-Based Hospital Funding in Alberta: Insights from Quebec and Australia

From the Montreal Economic Institute
Quebec has experienced increased productivity and efficiency, as well as reduced costs, in those sectors to which ABF has been applied
Alberta’s healthcare system costs more than those of many of its peers across Canada and internationally, yet underperforms by many metrics—wait times perhaps being the most visible.(1) For instance, while Alberta consistently spends a fair deal more per capita on health care than Canada’s other large provinces do, the median wait time from referral by a GP to treatment by a specialist was 33.3 weeks in 2022, versus 29.4 weeks in Quebec, 25.8 weeks in British Columbia, and 20.3 weeks in Ontario. Albertans waited a median 232 days for a hip replacement that year, longer than those in Quebec, British Columbia, and Ontario.(2) In Australia, meanwhile, the median wait time for a total hip replacement in 2022 was 175 days in public hospitals.(3)
One of the things keeping Alberta’s healthcare system from better performance is that it relies on global budgets for its hospital financing. Such a system allocates a pre-set amount of funding to pay for an expected number of services, based largely on historical volume. The problem with global budgets is that they disregard the actual costs incurred to deliver care, while undermining incentives to improve outcomes. This ultimately leads to rationing of care, with patients viewed as a cost that must be managed.
Activity-based funding systems are associated with reduced hospital costs, increased efficiency, and shorter wait times, among other things.
An alternative is activity-based funding (ABF), which has largely replaced global budgeting in many OECD countries, and is starting to do so in some Canadian provinces.(4) With ABF, hospitals receive a fixed payment for each specific service delivered, adjusted for certain parameters.(5) If a hospital treats more patients and delivers more services, it receives more funding; if it does less, it receives less. In essence, the money follows the patient, which has a dramatic effect: patients are now viewed as a source of revenue, not merely as a cost. Studies have shown that ABF systems that include appropriate safeguards for quality and waste are associated with reduced hospital costs, increased efficiency, and shorter wait times, among other things.(6)
To increase its capacity and performance, Alberta should consider moving to such a system for hospital financing. As over 25% of total health spending in the province goes to hospitals,(7) driving down costs and finding efficiencies is of paramount importance.
ABF models vary by jurisdiction and context to account for distinct situations and the particular policy objectives being pursued.(8) Two jurisdictions provide interesting insights: Quebec, with ABF hospital funding being gradually implemented in recent years, and Australia, where after more than three decades, ABF is the rule, global budgets the exception.
ABF in Quebec: Increased Performance and Decreased Costs
Quebec’s hospital payment reforms over the past two decades have been aimed at better linking funding with health care delivery to improve care quality and access.(9) These patient-based funding reforms (a type of ABF) have resulted in increased volumes and efficiency, and reduced costs and wait times for a number of surgical and other procedures in Quebec.(10)
These reforms started in 2004, when Quebec applied ABF in the context of additional funding to select surgeries in order to reduce wait times through the Access to Surgery Program.(11) The surgeries initially targeted were hip replacement, knee replacement, and cataract surgeries, but other procedures were eventually integrated into the program as well. Its funding covered the volume of surgeries that exceeded those performed in 2002-2003, and it used the average cost for each specific surgery. Procedures were classified by cost category, which also took into account the intensity of resource use and unit cost based on direct and indirect costs.
The expansion of ABF in Quebec aims to relieve hospital congestion by driving down wait times and shrinking wait lists.
By 2012-2013, this targeted program had helped to significantly increase the volume of surgeries performed, as well as decrease wait times and length of stay.(12) However, as ABF was applied only to surplus volumes of additional surgeries, efficiency gains were limited. For this reason, among others, the Expert Panel for Patient-Based Funding recommended expanding the program,(13) and in 2012, the Government of Quebec began considering further pilot projects for gradual ABF implementation.(14)
- In 2015, ABF was implemented in the radiation oncology sector, which resulted in better access to services at a lower cost, with productivity having increased more than 26% by 2023-2024, and average procedure costs having fallen 7%.(15)
- In 2017-2018, ABF was implemented in imaging, which resulted in the number of magnetic resonance imaging tests increasing more than 22% while driving the unit cost of procedures down 4%.(16)
- Following the above successes, in 2018-2019, the colonoscopy and digestive endoscopy sector also moved to ABF, which led to a productivity increase of 14% and a 31% decrease in the case backlog.(17)
Overall, then, Quebec has experienced increased productivity and efficiency, as well as reduced costs, in those sectors to which ABF has been applied (see Figure 1).

The Department of Health and Social Services continued to expand ABF to more surgeries in 2023, following which it was expected that about 25% of the care and services offered in physical health in Quebec hospitals would be funded in this manner, with the goal of reaching 100% by 2027-2028.(18) Further, the 2024-2025 budget expanded ABF again to include the medicine, emergency, neonatal, and dialysis sectors.
This expansion of ABF aims to relieve hospital congestion by driving down wait times and shrinking wait lists.(19) It will also align Quebec’s health care funding with what has become standard in most OECD countries. In Australia, for instance, ABF is the rule, not the exception, covering a large proportion of hospital services.
Australia’s Extensive Use of ABF
Australia also implemented ABF in stages, as Quebec is now doing. It was first introduced in the 1990s in one state and adopted nationally in 2012 for all admitted programs to increase efficiency, while also integrating quality and safety considerations.(20) These considerations act as safeguards to ensure efficiency incentives don’t negatively impact services. For instance, there are adjustments to the ABF payment framework in the presence of hospital acquired complications and avoidable hospital readmissions, two measures of hospital safety and service quality.(21) If service quality were to decrease, funding would be adjusted, and payments would be withheld. Not only has ABF been successful in increasing hospital efficiency in Australia, but it has also enabled proactive service improvement, which has in turn had a positive impact on safety and quality.(22)
ABF now makes up 87.0% of total hospital spending in Australia, ranging from 83.6% in Tasmania to 93.0% in the Australian Capital Territory.
Currently, ER services, acute services, admitted mental health services, sub-acute and non-acute services, and non-admitted services are funded with ABF in Australia. This includes rehabilitation, palliative, geriatric and/or maintenance care.(23) Global budgets are still used for some block funding, but this is the exception, restricted to certain hospitals, programs, or specific episodes of care.(24) Small rural hospitals, non-admitted mental health programs, and a few other highly specialized therapies or clinics or some community health services tend to be block funded due to higher than average costs stemming from a lack of economies of scale and inadequate volumes, among other things.
When first introduced, ABF made up about 25% of hospital revenue (approximately where Quebec currently stands).(25) ABF now makes up 87.0% of total hospital spending in Australia, ranging from 83.6% in Tasmania to 93.0% in the Australian Capital Territory (see Figure 2).

There is more variability, however, at the local hospital network level within territories or states. For instance, between 2019 and 2024, an average of 92.3% of total funding for the hospitals in the South Eastern Sydney Local Health District was ABF, and just 7.7% was block funding.(26) For the hospitals in the Far West Local Health District, in comparison, ABF represented an average of 72.0% of total funding, and block payments 28.0%, over the same period.(27)
The proportion of ABF funding per hospital is dictated, for the most part, by the types and volumes of patient services provided, but also by hospital characteristics and regional patient demographics.(28) For example, there could be a need to compensate for differences in hospital size and location, or to reimburse for some alternative element of the fixed cost of providing services. In the Far West Local Health District, on average 65.1% of block funding between 2019-2020 and 2023-2024 was provided for small rural hospitals, while only 1.4% of the block funding in the South Eastern Sydney Local Health District was for these types of hospitals.(29) Ultimately, these two districts serve very different populations, with the Far West Local Health District being the most thinly populated district in Australia.(30)
Overall, ABF implementation in Australia has significantly improved hospital performance. Early after ABF implementation, the volume of care in Australia increased, and waiting lists decreased by 16% in the first year.(31) Between 2005 and 2017 the hospitals that were funded by ABF in Queensland became more efficient than those receiving block funding.(32) In addition, ABF can contribute to reductions in extended lengths of stay and hospital readmission,(33) both of which are expensive propositions for health care systems and also tie up hospital beds and resources.
Conclusion
ABF has been associated with reduced hospital costs, increased efficiency, and shorter wait times, areas where Alberta is lacking and reform is needed. To increase its health system performance, Alberta should consider emulating Quebec and moving to an activity-based funding system. Indeed, based on the experience of countries like Australia, widespread application should be the goal, as it is in Quebec. Alberta patients have already waited far too long for timely access to the quality care they deserve. The time to act is now.
The MEI study is available here.
* * *
This Economic Note was prepared by Krystle Wittevrongel, Senior Policy Analyst and Alberta Project Lead at the MEI. The MEI’s Health Policy Series aims to examine the extent to which freedom of choice and entrepreneurship lead to improvements in the quality and efficiency of health care services for all patients.
The MEI is an independent public policy think tank with offices in Montreal and Calgary. Through its publications, media appearances, and advisory services to policy-makers, the MEI stimulates public policy debate and reforms based on sound economics and entrepreneurship.
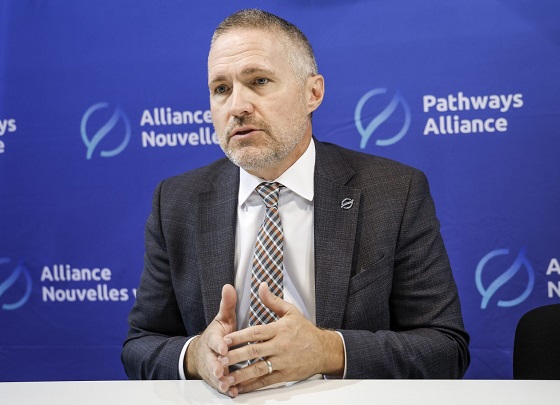
Pathways Alliance CEO Kendall Dilling is interviewed at the World Petroleum Congress in Calgary, Monday, Sept. 18, 2023.THE CANADIAN PRESS/Jeff McIntosh
From Resource Works
Carbon capture gives biggest bang for carbon tax buck CCS much cheaper than fuel switching: report
Canada’s climate change strategy is now joined at the hip to a pipeline. Two pipelines, actually — one for oil, one for carbon dioxide.
The MOU signed between Ottawa and Alberta two weeks ago ties a new oil pipeline to the Pathways Alliance, which includes what has been billed as the largest carbon capture proposal in the world.
One cannot proceed without the other. It’s quite possible neither will proceed.
The timing for multi-billion dollar carbon capture projects in general may be off, given the retreat we are now seeing from industry and government on decarbonization, especially in the U.S., our biggest energy customer and competitor.
But if the public, industry and our governments still think getting Canada’s GHG emissions down is a priority, decarbonizing Alberta oil, gas and heavy industry through CCS promises to be the most cost-effective technology approach.
New modelling by Clean Prosperity, a climate policy organization, finds large-scale carbon capture gets the biggest bang for the carbon tax buck.
Which makes sense. If oil and gas production in Alberta is Canada’s single largest emitter of CO2 and methane, it stands to reason that methane abatement and sequestering CO2 from oil and gas production is where the biggest gains are to be had.
A number of CCS projects are already in operation in Alberta, including Shell’s Quest project, which captures about 1 million tonnes of CO2 annually from the Scotford upgrader.
What is CO2 worth?
Clean Prosperity estimates industrial carbon pricing of $130 to $150 per tonne in Alberta and CCS could result in $90 billion in investment and 70 megatons (MT) annually of GHG abatement or sequestration. The lion’s share of that would come from CCS.
To put that in perspective, 70 MT is 10% of Canada’s total GHG emissions (694 MT).
The report cautions that these estimates are “hypothetical” and gives no timelines.
All of the main policy tools recommended by Clean Prosperity to achieve these GHG reductions are contained in the Ottawa-Alberta MOU.
One important policy in the MOU includes enhanced oil recovery (EOR), in which CO2 is injected into older conventional oil wells to increase output. While this increases oil production, it also sequesters large amounts of CO2.
Under Trudeau era policies, EOR was excluded from federal CCS tax credits. The MOU extends credits and other incentives to EOR, which improves the value proposition for carbon capture.
Under the MOU, Alberta agrees to raise its industrial carbon pricing from the current $95 per tonne to a minimum of $130 per tonne under its TIER system (Technology Innovation and Emission Reduction).
The biggest bang for the buck
Using a price of $130 to $150 per tonne, Clean Prosperity looked at two main pathways to GHG reductions: fuel switching in the power sector and CCS.
Fuel switching would involve replacing natural gas power generation with renewables, nuclear power, renewable natural gas or hydrogen.
“We calculated that fuel switching is more expensive,” Brendan Frank, director of policy and strategy for Clean Prosperity, told me.
Achieving the same GHG reductions through fuel switching would require industrial carbon prices of $300 to $1,000 per tonne, Frank said.
Clean Prosperity looked at five big sectoral emitters: oil and gas extraction, chemical manufacturing, pipeline transportation, petroleum refining, and cement manufacturing.
“We find that CCUS represents the largest opportunity for meaningful, cost-effective emissions reductions across five sectors,” the report states.

Fuel switching requires higher carbon prices than CCUS.
Measures like energy efficiency and methane abatement are included in Clean Prosperity’s calculations, but again CCS takes the biggest bite out of Alberta’s GHGs.
“Efficiency and (methane) abatement are a portion of it, but it’s a fairly small slice,” Frank said. “The overwhelming majority of it is in carbon capture.”

From left, Alberta Minister of Energy Marg McCuaig-Boyd, Shell Canada President Lorraine Mitchelmore, CEO of Royal Dutch Shell Ben van Beurden, Marathon Oil Executive Brian Maynard, Shell ER Manager, Stephen Velthuizen, and British High Commissioner to Canada Howard Drake open the valve to the Quest carbon capture and storage facility in Fort Saskatchewan Alta, on Friday November 6, 2015. Quest is designed to capture and safely store more than one million tonnes of CO2 each year an equivalent to the emissions from about 250,000 cars. THE CANADIAN PRESS/Jason Franson
Credit where credit is due
Setting an industrial carbon price is one thing. Putting it into effect through a workable carbon credit market is another.
“A high headline price is meaningless without higher credit prices,” the report states.
“TIER credit prices have declined steadily since 2023 and traded below $20 per tonne as of November 2025. With credit prices this low, the $95 per tonne headline price has a negligible effect on investment decisions and carbon markets will not drive CCUS deployment or fuel switching.”
Clean Prosperity recommends a kind of government-backstopped insurance mechanism guaranteeing carbon credit prices, which could otherwise be vulnerable to political and market vagaries.
Specifically, it recommends carbon contracts for difference (CCfD).
“A straight-forward way to think about it is insurance,” Frank explains.
Carbon credit prices are vulnerable to risks, including “stroke-of-pen risks,” in which governments change or cancel price schedules. There are also market risks.
CCfDs are contractual agreements between the private sector and government that guarantees a specific credit value over a specified time period.
“The private actor basically has insurance that the credits they’ll generate, as a result of making whatever low-carbon investment they’re after, will get a certain amount of revenue,” Frank said. “That certainty is enough to, in our view, unlock a lot of these projects.”
From the perspective of Canadian CCS equipment manufacturers like Vancouver’s Svante, there is one policy piece still missing from the MOU: eligibility for the Clean Technology Manufacturing (CTM) Investment tax credit.
“Carbon capture was left out of that,” said Svante co-founder Brett Henkel said.
Svante recently built a major manufacturing plant in Burnaby for its carbon capture filters and machines, with many of its prospective customers expected to be in the U.S.
The $20 billion Pathways project could be a huge boon for Canadian companies like Svante and Calgary’s Entropy. But there is fear Canadian CCS equipment manufacturers could be shut out of the project.
“If the oil sands companies put out for a bid all this equipment that’s needed, it is highly likely that a lot of that equipment is sourced outside of Canada, because the support for Canadian manufacturing is not there,” Henkel said.
Henkel hopes to see CCS manufacturing added to the eligibility for the CTM investment tax credit.
“To really build this eco-system in Canada and to support the Pathways Alliance project, we need that amendment to happen.”
Resource Works News

From the Canadian Energy Centre
Canada’s energy landscape changed significantly in 2025, with mounting U.S. economic pressures reinforcing the central role oil and gas can play in safeguarding the country’s independence.
Here are the Canadian Energy Centre’s top five most-viewed stories of the year.
5. Alberta’s massive oil and gas reserves keep growing – here’s why

The Northern Lights, aurora borealis, make an appearance over pumpjacks near Cremona, Alta., Thursday, Oct. 10, 2024. CP Images photo
Analysis commissioned this spring by the Alberta Energy Regulator increased the province’s natural gas reserves by more than 400 per cent, bumping Canada into the global top 10.
Even with record production, Alberta’s oil reserves – already fourth in the world – also increased by seven billion barrels.
According to McDaniel & Associates, which conducted the report, these reserves are likely to become increasingly important as global demand continues to rise and there is limited production growth from other sources, including the United States.
4. Canada’s pipeline builders ready to get to work

Photo courtesy Coastal GasLink
Canada could be on the cusp of a “golden age” for building major energy projects, said Kevin O’Donnell, executive director of the Mississauga, Ont.-based Pipe Line Contractors Association of Canada.
That eagerness is shared by the Edmonton-based Progressive Contractors Association of Canada (PCA), which launched a “Let’s Get Building” advocacy campaign urging all Canadian politicians to focus on getting major projects built.
“The sooner these nation-building projects get underway, the sooner Canadians reap the rewards through new trading partnerships, good jobs and a more stable economy,” said PCA chief executive Paul de Jong.
3. New Canadian oil and gas pipelines a $38 billion missed opportunity, says Montreal Economic Institute
Steel pipe in storage for the Trans Mountain Pipeline expansion in 2022. Photo courtesy Trans Mountain Corporation
In March, a report by the Montreal Economic Institute (MEI) underscored the economic opportunity of Canada building new pipeline export capacity.
MEI found that if the proposed Energy East and Gazoduq/GNL Quebec projects had been built, Canada would have been able to export $38 billion worth of oil and gas to non-U.S. destinations in 2024.
“We would be able to have more prosperity for Canada, more revenue for governments because they collect royalties that go to government programs,” said MEI senior policy analyst Gabriel Giguère.
“I believe everybody’s winning with these kinds of infrastructure projects.”
2. Keyera ‘Canadianizes’ natural gas liquids with $5.15 billion acquisition

Keyera Corp.’s natural gas liquids facilities in Fort Saskatchewan, Alta. Photo courtesy Keyera Corp.
In June, Keyera Corp. announced a $5.15 billion deal to acquire the majority of Plains American Pipelines LLP’s Canadian natural gas liquids (NGL) business, creating a cross-Canada NGL corridor that includes a storage hub in Sarnia, Ontario.
The acquisition will connect NGLs from the growing Montney and Duvernay plays in Alberta and B.C. to markets in central Canada and the eastern U.S. seaboard.
“Having a Canadian source for natural gas would be our preference,” said Sarnia mayor Mike Bradley.
“We see Keyera’s acquisition as strengthening our region as an energy hub.”
1. Explained: Why Canadian oil is so important to the United States

Enbridge’s Cheecham Terminal near Fort McMurray, Alberta is a key oil storage hub that moves light and heavy crude along the Enbridge network. Photo courtesy Enbridge
The United States has become the world’s largest oil producer, but its reliance on oil imports from Canada has never been higher.
Many refineries in the United States are specifically designed to process heavy oil, primarily in the U.S. Midwest and U.S. Gulf Coast.
According to the Alberta Petroleum Marketing Commission, the top five U.S. refineries running the most Alberta crude are:
- Marathon Petroleum, Robinson, Illinois (100% Alberta crude)
- Exxon Mobil, Joliet, Illinois (96% Alberta crude)
- CHS Inc., Laurel, Montana (95% Alberta crude)
- Phillips 66, Billings, Montana (92% Alberta crude)
- Citgo, Lemont, Illinois (78% Alberta crude)


-
 International2 days ago
“Captured and flown out”: Trump announces dramatic capture of Maduro
-
 International2 days ago
Trump Says U.S. Strike Captured Nicolás Maduro and Wife Cilia Flores; Bondi Says Couple Possessed Machine Guns
-
Energy1 day ago
The U.S. Just Removed a Dictator and Canada is Collateral Damage
-
 International1 day ago
US Justice Department Accusing Maduro’s Inner Circle of a Narco-State Conspiracy
-
 Haultain Research1 day ago
Trying to Defend Maduro’s Legitimacy
-
 Business2 days ago
Vacant Somali Daycares In Viral Videos Are Also Linked To $300 Million ‘Feeding Our Future’ Fraud
-
 Daily Caller24 hours ago
Trump Says US Going To Run Venezuela After Nabbing Maduro
-
International1 day ago
U.S. Claims Western Hemispheric Domination, Denies Russia Security Interests On Its Own Border