Economy
Welcome to the Era of Energy Realism
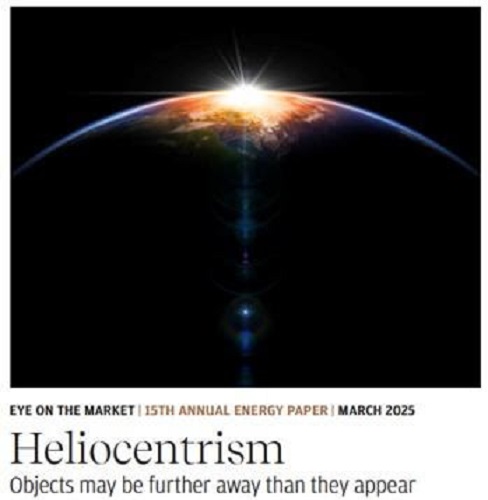

The Honest Broker  Roger Pielke Jr.
Every year for the past 15 years, JP Morgan publishes an outstanding annual energy report by Michael Cembalest. Last week JP Morgan published its 2025 edition and today I share five important figures from the many in the report, which I highly recommend.
Cembalest’s top line:
[A]fter $9 trillion globally over the last decade spent on wind, solar, electric vehicles, energy storage, electrified heat and power grids, the renewable transition is still a linear one; the renewable share of final energy consumption is slowly advancing at 0.3%–0.6% per year.
You can see that in the figure below — my graph using data from the 2024 EI Statistical Review of World Energy — which shows the proportion of global energy consumption from all carbon-free sources. Since 2012, that proportion has increased from about 14% to a bit over 18%. Exactly as Cembaest observes — that increase has been linear. At that rate of change the world would hit 100% carbon-free sometime after 2200.

Let’s take a look at some of the figures I found most interesting in the JP Morgan Report.
Solar Reality Check

“. . . when you boil it all down, solar power accounts for ~2% of global final energy consumption, a figure we expect to reach 4.5% by 2027. Even if these solar trends continue into the 2030’s, human prosperity will be inextricably linked to affordable natural gas and other fossil fuels for many years.
Human prosperity, in places where it thrives, relies heavily on steel, cement, ammonia/fertilizer, plastics, glass, chemicals and other industrial products which are energy- intensive to produce. . . these products currently rely on fossil fuels for 80%-85% of their energy.
And remember, prosperity itself is energy-intensive: among the tightest relationships in economics is the connection between a country’s per capita GDP and its per capita energy consumption.”
I remain very bullish on solar, but it won’t displace much fossil fuels anytime soon.
Electrify Everything is Proceeding Slowly


“Remember this key aspect of the energy transition: until an energy use is electrified, it’s hard to decarbonize it using green grid electrons. And while grid decarbonization is continuing at a steady pace, the US has made little progress increasing the electricity share of final energy consumption for the reasons discussed in last year’s “Electravision” piece. One major obstacle: transmission line growth is stuck in a rut, way below DoE targets for 2030 and 2035. Another obstacle: shortages of transformer equipment, whose delivery times have extended from 4-6 weeks in 2019 to 2-3 years. . . “
The panel on the rgiht above indicates that the U.S. was never going to meet the emissions reduction targets of the Biden Administration — which has been clear for several years now.

“The US is not unique with respect to the slow pace of electrification, although a few countries are making faster progress. Over the last decade China made the largest advance, bringing it in line with the OECD.
Part of the challenge may simply be the long useful lives of existing industrial plants, furnaces, boilers and vehicles. In other words, electrification might accelerate as their useful lives are exhausted. But the high cost of electricity compared to natural gas (particularly in places without a carbon tax) is another impediment to electrification that is not easy to solve since this ratio reflects relative total costs of production and distribution.”
(In order to coerce users, a carbon tax is necessary)
Energy Dependence and Independence

“The US has achieved US energy independence for the first time in 40 years while Europe and China compete for global energy resources. China’s imports are similar to Europe in energy terms but half as much as a share of domestic energy consumption. Energy intensive manufacturing has shifted to the developing world since the mid 1990’s. China is negotiating with Russia and Turkmenistan regarding future gas pipeline projects. China has the benefit of time: China gas imports are projected to reach 250 bcm by 2030 vs 170 bcm in 2023, almost all of which can be met by already contracted supplies. What was Taiwan thinking by shutting down nuclear power which has fallen from 50% to 5% of generation? Taiwan is now one of the most energy dependent countries in the world, resulting in rising economic costs if China were to impose a blockade.”
The Trump administration’s trade war with Canada risks upending North America’s energy dominance. What can they be thinking?
Fossil Fuels Falling and Rising

“Fossil fuel shares of final energy are falling faster in China, Japan and Europe than in the US. Growth in fossil fuel consumption is slowing but no clear sign of a peak on a global basis. Hydraulically fractured oil and gas account for 60%+ of US primary energy consumption. Global LNG export capacity is set to expand by one third by 2030. Coal consumption is roughly flat in final energy terms as rising EM consumption offsets falling OECD consumption.”
US Secretary of Energy Chris Wright spoke at an energy conference in Houston, and his remarks have been transcribed by Robert Bryce. Here is an excerpt:
Let’s do a quick survey of energy access today. Roughly one billion people live lives remotely recognizable to us in this room. We wear fancy clothes, mostly made out of hydrocarbons. We travel in motorized transport. The extra lucky of us fly across the world to attend conferences. We heat our homes in winter, cool them in summer, store myriad foods in our freezers and refrigerators, and have light, communications and entertainment at the flip of a switch.
Pretty awesome.
This lifestyle requires an average of 13 barrels of oil per person per year. What about the other seven billion people? They want what we have. The other seven billion people, on average, consume only three barrels of oil per person per year versus our 13. Africans average less than one barrel.
We need more energy. Lots more energy. That much should be obvious.
Read Wright’s speech alongside Cembalest’s energy analysis — We are at long last in an era of energy realism.
The Honest Broker
THB is reader supported.
Please consider a subscription or an upgrade to support work like that you just read.
![]()
From the Daily Caller News Foundation
By Steve Milloy
The Paris Climate Accord was adopted 10 years ago this week. It’s been a decade of disaster that President Donald Trump is rightly trying again to end.
The stated purpose of the agreement was for countries to voluntarily cut emissions to avoid the average global temperature exceeding the (guessed at) pre-industrial temperature by 3.6°F (2°C) and preferably 2.7°F (1.5°C).
Since December 2015, the world spent an estimated $10 trillion trying to achieve the Paris goals. What has been accomplished? Instead of reducing global emissions, they have increased about 12 percent. While the increase in emissions is actually a good thing for the environment and humanity, spending $10 trillion in a failed effort to cut emissions just underscores the agreement’s waste, fraud and abuse.
As a nonprofit, we are dependent on the generosity of our readers.
Please consider making a small donation of any amount here.
Thank you!
But wasting $10 trillion is only the tip of the iceberg.
The effort to cut emissions was largely based on forcing industrial countries to replace their tried-and-true fossil fuel-based energy systems with not-ready-for-prime-time wind, solar and battery-based systems. This forced transition has driven up energy costs and made energy systems less reliable. The result of that has been economy-crippling deindustrialization in former powerhouses of Germany and Britain.
And it gets worse.
European nations imagined they could reduce their carbon footprint by outsourcing their coal and natural gas needs to Russia. That outsourcing enriched Russia and made the European economy dependent on Russia for energy. That vulnerability, in turn, and a weak President Joe Biden encouraged Vladimir Putin to invade Ukraine.
The result of that has been more than one million killed and wounded, the mass destruction of Ukraine worth more than $500 billion so far and the inestimable cost of global destabilization. Europe will have to spend hundreds of billions more on defense, and U.S. taxpayers have been forced to spend hundreds of billions on arms for Ukraine. Putin has even raised the specter of using nuclear weapons.
President Barack Obama unconstitutionally tried to impose the Paris agreement on the U.S. as an Executive agreement rather than a treaty ratified by the U.S. Senate. Although Trump terminated the Executive agreement during his first administration, President Joe Biden rejoined the agreement soon after taking office, pledging to double Obama’s emissions cuts pledge to 50 percent below 2005 levels by 2030.
Biden’s emissions pledge was an impetus for the 2022 Inflation Reduction Act that allocated $1.2 trillion in spending for what Trump labeled as the Green New Scam. Although Trump’s One Big Beautiful Bill Act reduced that spending by about $500 billion and he is trying to reduce it further through Executive action, much of that money was used in an effort to buy the 2024 election for Democrats. The rest has been and will be used to wreck our electricity grid with dangerous, national security-compromising wind, solar and battery equipment from Communists China.
Then there’s this. At the Paris climate conference in 2015, U.S. Secretary of State John Kerry stated quite clearly that emissions cuts by the U.S. and other industrial countries were meaningless and would accomplish nothing since the developing world’s emissions would be increasing.
Finally, there is the climate realism aspect to all this. After the Paris agreement was signed and despite the increase in emissions, the average global temperature declined during the years from 2016 to 2022, per NOAA data.
The super El Nino experienced during 2023-2024 caused a temporary temperature spike. La Nina conditions have now returned the average global temperature to below the 2015-2016 level, per NASA satellite data. The overarching point is that any “global warming” that occurred over the past 40 years is actually associated with the natural El Nino-La Nina cycle, not emissions.
The Paris agreement has been all pain and no gain. Moreover, there was never any need for the agreement in the first place. A big thanks to President Trump for pulling us out again.
Steve Milloy is a biostatistician and lawyer. He posts on X at @JunkScience.
Business
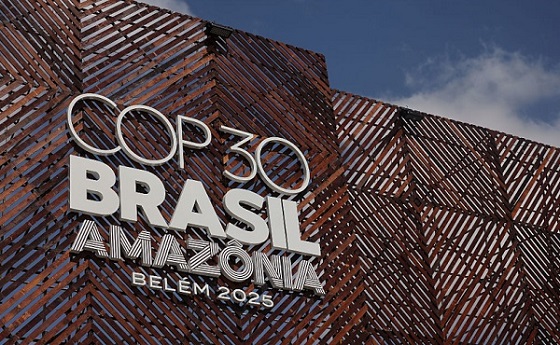
COP30 finally admits what resource workers already knew: prosperity and lower emissions must go hand in hand
From Resource Works
What a difference a few weeks make
Finally, the Conference of the Parties to the UN climate convention (COP30) adopted a pragmatic tone that will appeal to the working class. Too bad it took thirty meetings. Pragmatism produces results, not missed targets.
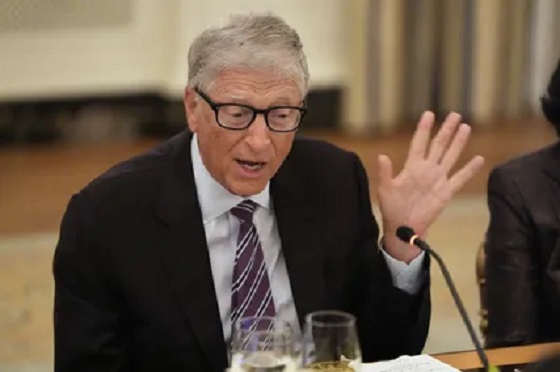
We should not have been surprised. Influential figures like Bill Gates and Canadian-Venezuelan analyst Quico Toro, who have long argued that efforts to reduce CO₂ should focus more on technology and prosperity, and less on energy consumption and declining growth, have gained ground.
In the World Energy Outlook 2025, prepared by the International Energy Agency for COP30, you can see that many of the views held by the people above had already gone mainstream before the conference started.
The World Energy Outlook 2025 lays out three scenarios: Current Policies (CPS), Stated Policies (STEPS), and Net Zero Emissions by 2050 (NZE). In WEO 2025, all three scenarios reflect longer timelines for the decline of fossil fuels than in earlier editions, and the NZE pathway explicitly states that major technological breakthroughs will be required.
Unfortunately, many potential technologies are adamantly opposed by the loudest groups within the Climate Change Movement because they are not perfect. Even some continue to oppose nuclear power, one of the few proven sources of large-scale, zero-carbon, firm electricity.
Another noteworthy standout in WEO 2025 was the strong recognition that energy security, costs, and supply chains are now the primary considerations in determining each country’s energy mix.
What all this means is we are breaking away from emotionally charged, fear-based policies and rhetoric and moving toward a practical “let’s do things better” approach.
For 30 years, the radical leadership of the environmental movement has focused on what we should stop doing and on sacrificing prosperity. Essentially, what has been going on is an attack on working people in the industrialized and developing world.
Today, workers in the developed world are so anxious that many are losing faith in democratic institutions. Meanwhile, people in the emerging and developing world see light at the end of the tunnel and are determined to industrialize.
Clearly, it is time to merge the fight to lower CO₂ emissions with prosperity. “Let’s do things better” captures the history of human progress and resonates with working people today.
What does it take for longer, healthier, safer, and more sustainable lives? It takes the pragmatism of workers. They spend their lives striving to improve workplace safety, to develop tools that enable them to perform tasks more effectively with less physical effort, to earn higher pay, to produce more food with less land, and to preserve their opportunity to continue working.
Resource workers have felt under attack and are humiliated when celebrities fly in on a helicopter to denigrate their work and make references to the virtues of small-plot gardening, or politicians who tell them to go back to school for “jobs of the future”, only to find themselves in low-paying service jobs.
As the COP30 discussion indicates, we have reached a turning point. It is time to focus on doing what needs to be done, but doing it better. It is time to stop banning activities entirely as though circumstances and technology never change. Demanding perfection hides what is possible, slows progress and, in some cases, stops it altogether.
Bill Gates’ memo to COP30 points to the turn in the road:
“We should measure success by our impact on human welfare more than our impact on the global temperature, and our success relies on putting energy, health, and agriculture at the centre of our strategies.”
Gates also makes a point that will resonate with working people: “Using more energy is a good thing because it is closely correlated with economic growth.” Ironically, a statement made by a billionaire resonates with working people more than does the message of many climate activists.
The work at the Port of Prince Rupert comes to mind, given its growing role in supplying cleaner cooking and heating fuels, when we are reminded that 2 billion people worldwide cook and/or heat their homes with highly polluting open fires (wood, charcoal, dung, agricultural waste).
Persuasion published Quico Toro’s essay on November 13, 2025, which speaks another truth.
“COP imagines these emissions as something a country’s government can set, like the dial on a thermostat. But emissions are more like GDP: the outcome of a complex process that politicians would like to be able to control, but do not actually control.”
I am feeling more secure about the future here in Canada and BC, as governments, First Nations and the public are leaning into climate and economic pragmatism.
There will be hard discussions and uncomfortable trade-offs. Past decisions need to be re-examined in good faith. Do they meet today’s demands? Are we doing what needs to be done better? Is it the right move for today’s youth and future generations? Will we bring back the hope and opportunity of a growing middle class?
Nobody, not the Liberal government, the BC NDP government, First Nations, none of us would have predicted the world we are facing today, where our economy and sovereignty are challenged.
Today, oil, natural gas, and critical minerals, not one or two but all three, are the financial backstop Canada needs, as we rebuild the economy and secure our sovereignty.
Look West: Jobs and Prosperity for Stronger BC and Canada is as much of an admission that we are falling behind as it is a call to action. Success will take billions of dollars, the exact amount unknown.
But what we do know is that oil, gas, and critical minerals generate the most public revenue, the highest incomes, and are our most significant exports. They are Canada’s bank and comparative advantage. They will provide the cash flow needed to get it done.
Not maximizing oil production and exports is fighting with both hands tied behind our back. We all know it; now we need to focus on doing it better because circumstances have changed dramatically.
Jim Rushton is a 46-year veteran of BC’s resource and transportation sectors, with experience in union representation, economic development, and terminal management.
Resource Works News


Wayne Gretzky’s Terrible, Awful Week.. And Soccer/ Football.

Western Campuses Help Build China’s Digital Dragnet With U.S. Tax Funds, Study Warns

Common Vaccines Linked to 38-50% Increased Risk of Dementia and Alzheimer’s

Trump DOJ seeks to quash Pfizer whistleblower’s lawsuit over COVID shots
-
 Great Reset2 days ago
Viral TikTok video shows 7-year-old cuddling great-grandfather before he’s euthanized
-
 Daily Caller2 days ago
Chinese Billionaire Tried To Build US-Born Baby Empire As Overseas Elites Turn To American Surrogates
-
 Alberta2 days ago
Schools should go back to basics to mitigate effects of AI
-
 International2 days ago
At Least 15 Killed In Shooting Targeting Jewish Community At Australia’s Bondi Beach, Police Say
-
 International2 days ago
Two states designate Muslim group as terrorist
-
 Business2 days ago
Major tax changes in 2026: Report
-
 Digital ID1 day ago
Canada releases new digital ID app for personal documents despite privacy concerns
-
 Bruce Dowbiggin1 day ago
NFL Ice Bowls Turn Down The Thermostat on Climate Change Hysteria