Connect with us

Business

What Inter-Provincial Migration Trends Can Tell Us About Good Governance

Published

6 minute read


It turns out we move a great deal less than our American neighbors

Government policies have consequences. Among them is the possibility that they might so annoy the locals that people actually get up and head for the exit. Given how parting can be such sweet sorrow (and how it’s a pain to lose out on all that revenue from provincial income, property, and sales tax), legislatures generally prefer to keep their citizens on this side of the door.

Nevertheless, migration happens. And when enough people do it at the same time, they sometimes leave economic and social clues behind waiting to be discovered. This graph represents net migrations since 1971 into and out of the four largest provinces:

The Audit is a reader-supported publication. To receive new posts and support my work, consider becoming a free or paid subscriber.

It may just be possible to make out some broad patterns here. Quebec has never had a net inbound migration year (although there’s been plenty of immigration to Quebec from outside of Canada). But nothing matches the mass exodus of anglophones due to concerns over language and separation in the 1970s.

Curiously it seems that Alberta and British Columbia received far more migrants than Ontario around that time – although the actual numbers tell us that they were more likely to have come from Saskatchewan and Ontario than Quebec. By contrast, most disillusioned Quebecers found their way to Ontario. Besides the 70s, Alberta also enjoyed inbound spikes in the mid-90s, mid-00s, and early 10s. And it looks like they’re in the middle of another boom cycle as we speak.

The real value of all this data however, is in using it to test causation hypotheses. In other words, can statistical analysis tell us what it was that caused the migrations? And are some or all of those causes the result of government policy choices? Here are some possibilities we’ll explore:

  • Household income trends
  • Government debt
  • Crime rates
  • Healthcare costs
  • Housing costs

Right off the top I’ll come clean with you: there’ll be no smoking gun here. I could find no single historical measure that came close to explaining migration patterns. However I was able to confidently discard some theories. That’s a win I guess. And other numbers did hint to intriguing possibilities.

Inter-provincial variations in household income, crime rates (specifically murder rates), healthcare costs (including prescriptions, eye care, and dental care), and even housing affordability had no measurable impact on migration. This was true for both correlation coefficients and lag analysis (where we looked at migration changes in the years following an economic event).

Rising unemployment had, at best, a minimal impact on outbound migration. And even then, it was only noticeable for Alberta and Prince Edward Island.

Of all the metrics I explored, the only one that might have had a serious influence in migration was provincial government budget deficits.

Folks from Alberta, New Brunswick, and Newfoundland all responded to growing government debt by clearing out. Now, I doubt this was their way to telling the government what they really thought about bad fiscal management. Rather, people probably decided to move to greener pastures in response to the ripple-effect consequences of deficits, like higher taxes, reduced social services, and deteriorating infrastructure.


I suspect that part of the reason I wasn’t able to find any strong connections between those metrics and migration patterns is because there really isn’t all that much migration going on in the first place.

Take Ontario’s record net population loss of 31,018 residents back in 2021. That may sound like a lot of people, but it’s actually just a hair over two-tenths of one percent of the total Ontario population. And even Quebec’s epic 1979 loss of 46,429 people was still nowhere near one percent. It was 0.7117456, to be precise. Those aren’t significant numbers.

When so few people choose to move, it’s probably because there’s nothing on the macro level going on that’s pushing them. Those who do go, probably do it primarily for personal reasons that just won’t show up in population-scale data.

There’s also the very real possibility that Canadians are smart enough to realize that things probably won’t be any better over there than they already are right here. Fewer than two-thirds of one percent of Ontarians left for other provinces in 2023, while only around one-third of a percent gave up on Quebec.

By contrast, annual state-to-state migration figures in the U.S. typically range between 1 percent to 5 percent of each state’s population. In 2022, that added up to 8.2 million people, according to the Census Bureau.

Subscribe to The Audit. For the full experience, upgrade your subscription.

In the market for bespoke data analysis?

Custom Reports by The Audit

Todayville is a digital media and technology company. We profile unique stories and events in our community. Register and promote your community event for free.

Follow Author

Business

Massive government child-care plan wreaking havoc across Ontario

Published on

From the Fraser Institute

By Matthew Lau

It’s now more than four years since the federal Liberal government pledged $30 billion in spending over five years for $10-per-day national child care, and more than three years since Ontario’s Progressive Conservative government signed a $13.2 billion deal with the federal government to deliver this child-care plan.

Not surprisingly, with massive government funding came massive government control. While demand for child care has increased due to the government subsidies and lower out-of-pocket costs for parents, the plan significantly restricts how child-care centres operate (including what items participating centres may purchase), and crucially, caps the proportion of government funds available to private for-profit providers.

What have families and taxpayers got for this enormous government effort? Widespread child-care shortages across Ontario.

For example, according to the City of Ottawa, the number of children (aged 0 to 5 years) on child-care waitlists has ballooned by more than 300 per cent since 2019, there are significant disparities in affordable child-care access “with nearly half of neighbourhoods underserved, and limited access in suburban and rural areas,” and families face “significantly higher” costs for before-and-after-school care for school-age children.

In addition, Ottawa families find the system “complex and difficult to navigate” and “fewer child care options exist for children with special needs.” And while 42 per cent of surveyed parents need flexible child care (weekends, evenings, part-time care), only one per cent of child-care centres offer these flexible options. These are clearly not encouraging statistics, and show that a government-knows-best approach does not properly anticipate the diverse needs of diverse families.

Moreover, according to the Peel Region’s 2025 pre-budget submission to the federal government (essentially, a list of asks and recommendations), it “has maximized its for-profit allocation, leaving 1,460 for-profit spaces on a waitlist.” In other words, families can’t access $10-per-day child care—the central promise of the plan—because the government has capped the number of for-profit centres.

Similarly, according to Halton Region’s pre-budget submission to the provincial government, “no additional families can be supported with affordable child care” because, under current provincial rules, government funding can only be used to reduce child-care fees for families already in the program.

And according to a March 2025 Oxford County report, the municipality is experiencing a shortage of child-care staff and access challenges for low-income families and children with special needs. The report includes a grim bureaucratic predication that “provincial expansion targets do not reflect anticipated child care demand.”

Child-care access is also a problem provincewide. In Stratford, which has a population of roughly 33,000, the municipal government reports that more than 1,000 children are on a child-care waitlist. Similarly in Port Colborne (population 20,000), the city’s chief administrative officer told city council in April 2025 there were almost 500 children on daycare waitlists at the beginning of the school term. As of the end of last year, Guelph and Wellington County reportedly had a total of 2,569 full-day child-care spaces for children up to age four, versus a waitlist of 4,559 children—in other words, nearly two times as many children on a waitlist compared to the number of child-care spaces.

More examples. In Prince Edward County, population around 26,000, there are more than 400 children waitlisted for licensed daycare. In Kawartha Lakes and Haliburton County, the child-care waitlist is about 1,500 children long and the average wait time is four years. And in St. Mary’s, there are more than 600 children waitlisted for child care, but in recent years town staff have only been able to move 25 to 30 children off the wait list annually.

The numbers speak for themselves. Massive government spending and control over child care has created havoc for Ontario families and made child-care access worse. This cannot be a surprise. Quebec’s child-care system has been largely government controlled for decades, with poor results. Why would Ontario be any different? And how long will Premier Ford allow this debacle to continue before he asks the new prime minister to rethink the child-care policy of his predecessor?

Matthew Lau

Adjunct Scholar, Fraser Institute
Continue Reading

Business

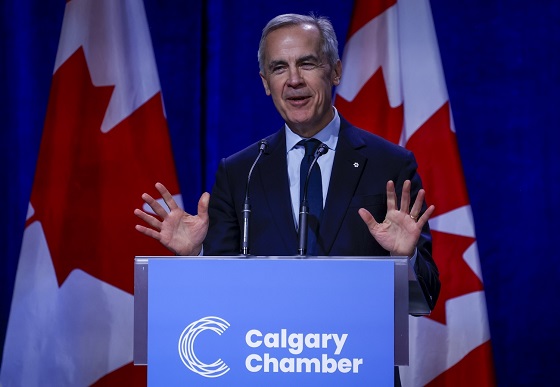
Canada Caves: Carney ditches digital services tax after criticism from Trump

Published on

From The Center Square

By

Canada caved to President Donald Trump demands by pulling its digital services tax hours before it was to go into effect on Monday.

Trump said Friday that he was ending all trade talks with Canada over the digital services tax, which he called a direct attack on the U.S. and American tech firms. The DST required foreign and domestic businesses to pay taxes on some revenue earned from engaging with online users in Canada.

“Based on this egregious Tax, we are hereby terminating ALL discussions on Trade with Canada, effective immediately,” the president said. “We will let Canada know the Tariff that they will be paying to do business with the United States of America within the next seven day period.”

By Sunday, Canada relented in an effort to resume trade talks with the U.S., it’s largest trading partner.

“To support those negotiations, the Minister of Finance and National Revenue, the Honourable François-Philippe Champagne, announced today that Canada would rescind the Digital Services Tax (DST) in anticipation of a mutually beneficial comprehensive trade arrangement with the United States,” according to a statement from Canada’s Department of Finance.

Canada’s Department of Finance said that Prime Minister Mark Carney and Trump agreed to resume negotiations, aiming to reach a deal by July 21.

U.S. Commerce Secretary Howard Lutnick said Monday that the digital services tax would hurt the U.S.

“Thank you Canada for removing your Digital Services Tax which was intended to stifle American innovation and would have been a deal breaker for any trade deal with America,” he wrote on X.

Earlier this month, the two nations seemed close to striking a deal.

Trump said he and Carney had different concepts for trade between the two neighboring countries during a meeting at the G7 Summit in Kananaskis, in the Canadian Rockies.

Asked what was holding up a trade deal between the two nations at that time, Trump said they had different concepts for what that would look like.

“It’s not so much holding up, I think we have different concepts, I have a tariff concept, Mark has a different concept, which is something that some people like, but we’re going to see if we can get to the bottom of it today.”

Shortly after taking office in January, Trump hit Canada and Mexico with 25% tariffs for allowing fentanyl and migrants to cross their borders into the U.S. Trump later applied those 25% tariffs only to goods that fall outside the free-trade agreement between the three nations, called the United States-Mexico-Canada Agreement.

Trump put a 10% tariff on non-USMCA compliant potash and energy products. A 50% tariff on aluminum and steel imports from all countries into the U.S. has been in effect since June 4. Trump also put a 25% tariff on all cars and trucks not built in the U.S.

Economists, businesses and some publicly traded companies have warned that tariffs could raise prices on a wide range of consumer products.

Trump has said he wants to use tariffs to restore manufacturing jobs lost to lower-wage countries in decades past, shift the tax burden away from U.S. families, and pay down the national debt.

A tariff is a tax on imported goods paid by the person or company that imports them. The importer can absorb the cost of the tariffs or try to pass the cost on to consumers through higher prices.

Trump’s tariffs give U.S.-produced goods a price advantage over imported goods, generating revenue for the federal government.

Continue Reading

Trending

X