Fraser Institute
Scathing auditor general reports underscore political realities

From the Fraser Institute
By Jake Fuss
Nearly 20 per cent of the SDTC projects examined by the AG were in fact ineligible (based on the government’s own rules) for funding, with a total price tag of $59 million. There were also 90 instances where the SDTC ignored conflict of interest provisions while awarding $76 million to various projects. Indeed, the AG found 63 cases where SDTC agency directors voted in favour of payments to companies in which they had declared interests.
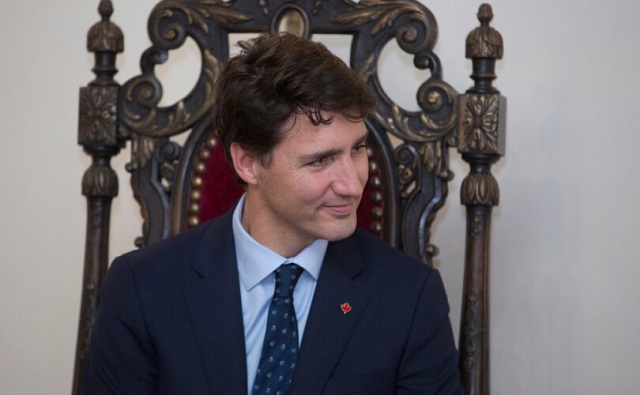
If you needed more proof that the Trudeau government is misusing taxpayer money, the auditor general (AG) just released two scathing reports about improper contracting practices, conflict of interest, and funding provided for ineligible projects. Clearly, politicians and bureaucrats in Ottawa do not always act in the best interest of Canadians.
According to the first AG report, Sustainable Development Technology Canada (SDTC), the federal agency responsible for funding green technology projects, demonstrated “significant lapses… in governance and stewardship of public funds.” Nearly 20 per cent of the SDTC projects examined by the AG were in fact ineligible (based on the government’s own rules) for funding, with a total price tag of $59 million. There were also 90 instances where the SDTC ignored conflict of interest provisions while awarding $76 million to various projects. Indeed, the AG found 63 cases where SDTC agency directors voted in favour of payments to companies in which they had declared interests.
The second AG report focused on 97 contracts totalling $209 million awarded by the federal government to the McKinsey & Company consulting firm from 2011 to 2023. According to the AG, the government demonstrated “frequent disregard for procurement policies and guidance and that contracting practices often did not demonstrate value for money.” About 70 per cent of these contracts were awarded non-competitively—meaning no other companies were permitted to bid on the contracts.
These findings also follow an earlier report in February that found the federal government “repeatedly failed to follow good management practices in the contracting, development, and implementation” of the ArriveCAN mobile app, which cost Canadian taxpayers at least $59.5 million.
While the Trudeau government’s record-high levels of spending have made it clear that taxpayer money is being dished out left and right without much regard for the consequences for future generations of Canadians, the AG reports reveal chronic mismanagement, little accountability, and decision-makers acting in their own interests.

Government officials are handing huge sums of taxpayer money to people or companies who spend it without proper transparency or oversight. When considering these findings, Canadians should be skeptical of any politician or commentator who downplays government excesses or says we can’t reduce federal spending.
It’s also naïve to think that politicians and bureaucrats are benevolent civil servants who simply want to make the world a better place. In reality, like most people, they’re human beings motivated by self-interest.
James Buchanan, who won the Nobel Prize in economics in 1986, explained these concepts when pioneering a branch of economics called Public Choice Theory, which pays particular attention to the incentives policymakers face.
Politicians do not always act in the best interest of their constituents, and bureaucrats do not always act in the best interests of the public.
Why? Because it’s often in their interest to make decisions that benefit themselves, family members, friends or other cronies. If you decide to give money to companies despite a conflict of interest or if you award contracts to friends, you’re not making decisions in the best interest of society. People don’t suddenly become selfless when they enter the government sector. They respond to the same incentives as everyone else. The latest AG reports underscore this reality.
Author:


From the Fraser Institute
By Tegan Hill
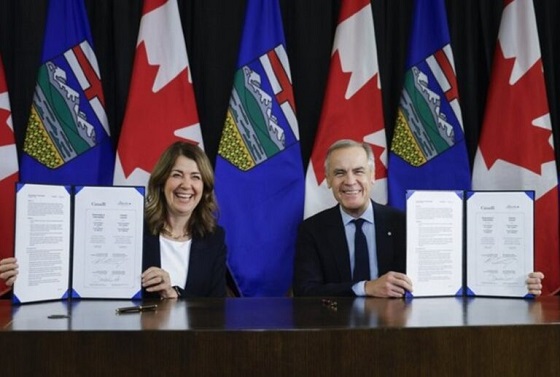
Last Friday, less than a week before Christmas, the Smith government quietly released the final report from its Alberta Next Panel, which assessed Alberta’s role in Canada. Among other things, the panel recommends that the federal government transfer some of its tax revenue to provincial governments so they can assume more control over the delivery of provincial services. Based on Canada’s experience in the 1990s, this plan could deliver real benefits for Albertans and all Canadians.
Federations such as Canada typically work best when governments stick to their constitutional lanes. Indeed, one of the benefits of being a federalist country is that different levels of government assume responsibility for programs they’re best suited to deliver. For example, it’s logical that the federal government handle national defence, while provincial governments are typically best positioned to understand and address the unique health-care and education needs of their citizens.
But there’s currently a mismatch between the share of taxes the provinces collect and the cost of delivering provincial responsibilities (e.g. health care, education, childcare, and social services). As such, Ottawa uses transfers—including the Canada Health Transfer (CHT)—to financially support the provinces in their areas of responsibility. But these funds come with conditions.
Consider health care. To receive CHT payments from Ottawa, provinces must abide by the Canada Health Act, which effectively prevents the provinces from experimenting with new ways of delivering and financing health care—including policies that are successful in other universal health-care countries. Given Canada’s health-care system is one of the developed world’s most expensive universal systems, yet Canadians face some of the longest wait times for physicians and worst access to medical technology (e.g. MRIs) and hospital beds, these restrictions limit badly needed innovation and hurt patients.
To give the provinces more flexibility, the Alberta Next Panel suggests the federal government shift tax points (and transfer GST) to the provinces to better align provincial revenues with provincial responsibilities while eliminating “strings” attached to such federal transfers. In other words, Ottawa would transfer a portion of its tax revenues from the federal income tax and federal sales tax to the provincial government so they have funds to experiment with what works best for their citizens, without conditions on how that money can be used.
According to the Alberta Next Panel poll, at least in Alberta, a majority of citizens support this type of provincial autonomy in delivering provincial programs—and again, it’s paid off before.
In the 1990s, amid a fiscal crisis (greater in scale, but not dissimilar to the one Ottawa faces today), the federal government reduced welfare and social assistance transfers to the provinces while simultaneously removing most of the “strings” attached to these dollars. These reforms allowed the provinces to introduce work incentives, for example, which would have previously triggered a reduction in federal transfers. The change to federal transfers sparked a wave of reforms as the provinces experimented with new ways to improve their welfare programs, and ultimately led to significant innovation that reduced welfare dependency from a high of 3.1 million in 1994 to a low of 1.6 million in 2008, while also reducing government spending on social assistance.
The Smith government’s Alberta Next Panel wants the federal government to transfer some of its tax revenues to the provinces and reduce restrictions on provincial program delivery. As Canada’s experience in the 1990s shows, this could spur real innovation that ultimately improves services for Albertans and all Canadians.

Tegan Hill
Director, Alberta Policy, Fraser Institute
From the Fraser Institute
By Jason Clemens and Niels Veldhuis
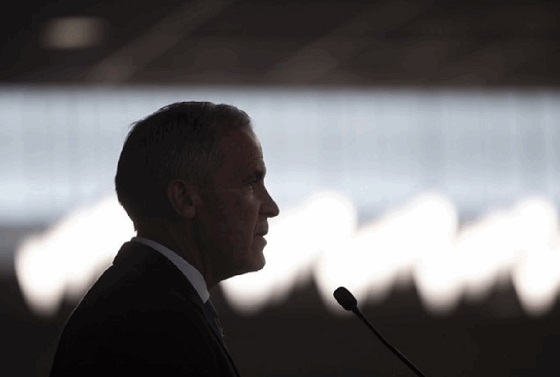
A number of pundits and commentators have observed the self-confidence and near-unilateralist approach of our prime minister, Mark Carney. The seemingly boundless self-assurance of the prime minister in his own abilities to do the right thing has produced legislation that sets the foundation for corruption.
Consider the Carney government’s signature legislation, known as the Building Canada Act (Bill C-5), which among other things established the Major Projects Office (MPO). The stated purpose of the MPO and the act is to create a process whereby the government—in practical terms, the prime minister and his cabinet—identify projects in the “national interest” and fast-track their approval by overriding existing laws and regulations.
Put differently, a small group of politicians are now able to circumvent the laws and regulations that apply to every other entrepreneur, businessowner and investor to expedite projects they deem will benefit the country. According to several reports, senators openly referred to the bill as the “trust me” act because it lacked details and guardrails, which meant “trusting” that the prime minister and cabinet would use these new powers reasonably and responsibly.
Rather than fix the actual policies causing problems, which include a litany of laws and regulations from the Trudeau era such as Bill C-69 (which added vague criteria to the approval process for large infrastructure projects including pipelines) and Bill C-48 (which bans oil tankers from docking in British Columbia ports), the Carney government chose to create a new bureaucracy and political process to get around these rules.
And that’s the problem. By granting itself power to get around rules that everyone else has to play by, the government created the opportunity for corruption. Entrepreneurs, businessowners and investors interested in infrastructure projects, particularly energy projects, now need to consider how to convince a handful of politicians of the merits of their project. This lays the groundwork for potentially corrosive and damaging corruption now and into the future. While this prime minister may have an infinite amount of confidence in his abilities to do the right thing, what about the next prime minister, or the next one? These rules will outlive Prime Minister Carney and his government.
And it’s not just the Carney government’s signature Build Canada Act. The more recent Bill C-15, which implements certain aspects of the federal budget, contains provisions similar to the Build Canada Act that would also allow cabinet ministers to circumvent existing laws and regulations. A number of commentators have raised red flags about how the legislation would empower any minister to exempt any entity (i.e. person or firm) from any law or regulation—except the Criminal Code—under the minister’s responsibility for up to six years in order to foster innovation. The underlying rationale is that we have laws and regulations on the books that impede experimentation and innovation.
Again, rather than undertake the difficult work of updating and modernizing existing laws and regulations to empower entrepreneurs, businessowners, workers, and investors, and ensure they all play by the same rules, the Carney government instead wants to create a new mechanism for a select few to be able to sidestep existing laws and regulations.
A different way to think about both legislative initiatives is that the prime minister and his ministers are now able to provide specific companies with enormous advantages over their competitors through the political system. Those advantages have enormous value, and that value creates the opportunity for corruption now and in the future.
The Carney government recognizes that our regulatory system is badly broken, otherwise it wouldn’t create these work-around laws. It should do the hard work, which it was elected to do, and actually fix the laws and regulations that impede economic development and progress for all entrepreneurs, businessowners and investors. Otherwise, we risk a future littered with stories of advantage and corruption for political insiders.

Jason Clemens
Executive Vice President, Fraser Institute

Niels Veldhuis


Alberta Next Panel calls to reform how Canada works

All 12 Vaccinated vs. Unvaccinated Studies Found the Same Thing: Unvaccinated Children Are Far Healthier

Canadian government launches trial version of digital ID for certain licenses, permits

Georgia county admits illegally certifying 315k ballots in 2020 presidential election
-
International2 days ago
Georgia county admits illegally certifying 315k ballots in 2020 presidential election
-
 Business2 days ago
The “Disruptor-in-Chief” places Canada in the crosshairs
-
 Artificial Intelligence2 days ago
UK Police Pilot AI System to Track “Suspicious” Driver Journeys
-
 Energy2 days ago
‘The electric story is over’
-
 Business2 days ago
Warning Canada: China’s Economic Miracle Was Built on Mass Displacement
-
 Energy2 days ago
The Top News Stories That Shaped Canadian Energy in 2025 and Will Continue to Shape Canadian Energy in 2026
-
 Daily Caller1 day ago
US Halts Construction of Five Offshore Wind Projects Due To National Security
-
Alberta1 day ago
Alberta Next Panel calls for less Ottawa—and it could pay off