Canadian Energy Centre
North America LNG project cost competitiveness
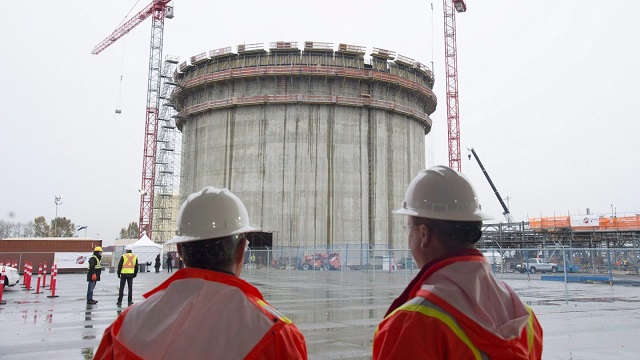

Construction workers look on at the FortisBC Tilbury LNG expansion project in Delta, B.C., Monday, Nov. 16, 2015. CP Images photo
From the Canadian Energy Centre
Lower costs for natural gas, shipping and liquefaction give Canada an edge in the emerging global LNG market
Worldwide concerns about energy security have put a renewed focus on the international liquefied natural gas (LNG) industry. The global demand for LNG is expected to increase over the next few decades.
Global demand growth will be driven primarily by Asian markets where the need for LNG is expected to increase from 277 million tonnes (MT) in 2025 to 509 MT by 2050 (see Figure 1). By 2050 the demand for LNG in Europe will be 83 MT and in Africa 20 MT. In South America too, demand will increase – from 13 MT in 2025 to 31 MT in 2050.

Source: Derived from Rystad Energy, Gas and LNG Markets Solution.
In North America (Canada, Mexico, and United States) a number of LNG projects that are either under construction or in the planning stages will benefit from the rise in global LNG demand.
North American LNG production is expected to grow from 112 MT in 2025 to over 255 MT by 2050 (see Figure 2). In Canada, the LNG projects under construction or in the planning stages include LNG Canada Phases 1 & 2, Woodfibre LNG, Cedar LNG, the Tilbury LNG expansion, and Ksi Lisims LNG. Canada’s LNG production is expected to grow from just 2 MT in 2025 to over 43 MT by 2050. In the United States production is projected to increase from 108 MT in 2025 to 210 MT in 2050.

Source: Derived from Rystad Energy, Gas and LNG Markets Solution.
This CEC Fact Sheet uses Rystad Energy’s Gas and LNG Markets Solution¹ to benchmark the cost competitiveness of LNG projects that are under construction and proposed in Canada compared to other LNG projects under construction and planned elsewhere in North America. (Note that the content of this report does not represent the views of Rystad Energy.)
The LNG cost competitiveness benchmarking analysis used the following performance metrics:
- LNG plant free-on-board (FOB) cost break-even;
- Total LNG plant cost (for delivery into Asia and Europe).
The objective of this LNG cost competitiveness benchmarking is to compare the competitiveness of Canadian LNG projects against those of major competitors in the United States and Mexico. The selection of other North American LNG facilities for the benchmark comparison with Canadian LNG projects (LNG Canada, the Tilbury LNG Expansion, Woodfibre LNG, Cedar LNG, and Ksi Lisims LNG) is based on the rationale that virtually all Canadian LNG plants are under construction or in the planning stage and that they compare well with other North American LNG plants that are also under construction or are being planned between 2023 and 2050. Further, to assess the cost competitiveness of the various LNG projects more accurately, we chose only North American LNG facilities with sufficient economic data to enable such a comparison. We compared the cost competitiveness of LNG coming from these other North American projects with LNG coming from Canada that is intended to be delivered to markets in Asia and Europe.
1. Rystad Energy is an independent energy research company providing data, analytics, and consultancy services to clients around the globe. Its Gas and LNG Markets Solution provides an overview of LNG markets worldwide. The Solution covers the entire value chain associated with gas and LNG production, country and sector-level demand, and LNG trade flows, infrastructure, economics, costs, and contracts through 2050. It allows for the evaluation of the entire LNG market infrastructure, including future planned projects, as well as the benchmarking of costs for LNG projects (Rystad Energy, 2024).
Comparison of LNG project FOB cost break-even (full cycle)
Figure 3 provides a comparison of the free-on-board (FOB) cost break-even for LNG facilities under construction or being planned in North America. FOB break-even costs include upstream and midstream costs for LNG excluding transportation costs (shipping) as seen from the current year. Break-even prices assume a discount rate of 10 percent and represent the point at which the net present value for an LNG project over a 20- to 30-year period becomes positive, including the payment of capital and operating costs, inclusive of taxes.
Among the selected group of North American LNG projects are Canadian LNG projects with an FOB break-even at the lower end of the range (US$7.18 per thousand cubic feet (kcf)) to those at the higher end (US$8.64 per thousand cubic feet (kcf)).
LNG projects in the United States tend to settle in the middle of the pack, with FOB break-even between US$6.44 per kcf and US$8.37 per kcf.

Mexico LNG projects have the widest variation in costs among the selected group of projects, ranging from US$6.94 per kcf to US$9.44 per kcf (see Figure 3).

Source: Derived from Rystad Energy, Gas and LNG Markets Solution.
Total costs by project for LNG delivery to Asia and Europe
The total cost by LNG plant includes FOB cost break-even, transportation costs, and the regasification tariff. Figure 4 compares total project costs for LNG destined for Asia from selected North American LNG facilities.
Canadian LNG projects are very cost competitive, and those with Asia as their intended market tend to cluster at the lower end of the scale. The costs vary by project, but range between US$8.10 per kcf and US$9.56 per kcf, making Canadian LNG projects among the lowest cost projects in North America.
The costs for Mexico’s LNG projects with Asia as the intended destination for their product tend to cluster in the middle of the pack. Costs among U.S. LNG facilities that plan to send their product to Asia tend to sit at the higher end of the scale, at between US$8.90 and US$10.80 per kcf.

Source: Derived from Rystad Energy, Gas and LNG Markets Solution.
Figure 5 compares total project costs for LNG to be delivered to Europe from select North American LNG facilities.
Costs from U.S. LNG facilities show the widest variation for this market at between US$7.48 per kcf and US$9.42 per kcf, but the majority of U.S. LNG facilities tend to cluster at the lower end of the cost scale, between US$7.48 per kcf and US$8.61 per kcf (see Figure 5).
Canadian projects that intend to deliver LNG to Europe show a variety of costs that tend to cluster at the middle to higher end of the spectrum, ranging from US$9.60 per kcf to and US$11.06 per kcf.
The costs of Mexico’s projects that are aimed at delivering LNG to Europe tend to cluster in the middle of the spectrum (US$9.11 per kcf to US$10.61 per kcf).

Source: Derived from Rystad Energy, Gas and LNG Markets Solution.
Conclusion
LNG markets are complex. Each project is unique and presents its own challenges. The future of Canadian LNG projects depends upon the overall demand and supply in the global LNG market. As the demand for LNG increases in the next decades, the world will be searching for energy security.
The lower liquefaction and shipping costs coupled with the lower cost of the natural gas itself in Western Canada translate into lower prices for Canadian LNG, particularly that destined for Asian markets. Those advantages will help make Canadian LNG very competitive and attractive to markets worldwide.

From the Canadian Energy Centre
By Will Gibson
Oil sands could maintain current production rates for more than 140 years
Investor interest in Canadian oil producers, primarily in the Alberta oil sands, has picked up, and not only because of expanded export capacity from the Trans Mountain pipeline.
Enverus Intelligence Research says the real draw — and a major factor behind oil sands equities outperforming U.S. peers by about 40 per cent since January 2024 — is the resource Trans Mountain helps unlock.
Alberta’s oil sands contain 167 billion barrels of reserves, nearly four times the volume in the United States.
Today’s oil sands operators hold more than twice the available high-quality resources compared to U.S. shale producers, Enverus reports.
“It’s a huge number — 167 billion barrels — when Alberta only produces about three million barrels a day right now,” said Mike Verney, executive vice-president at McDaniel & Associates, which earlier this year updated the province’s oil and gas reserves on behalf of the Alberta Energy Regulator.
Already fourth in the world, the assessment found Alberta’s oil reserves increased by seven billion barrels.
Verney said the rise in reserves despite record production is in part a result of improved processes and technology.
“Oil sands companies can produce for decades at the same economic threshold as they do today. That’s a great place to be,” said Michael Berger, a senior analyst with Enverus.
BMO Capital Markets estimates that Alberta’s oil sands reserves could maintain current production rates for more than 140 years.
The long-term picture looks different south of the border.
The U.S. Energy Information Administration projects that American production will peak before 2030 and enter a long period of decline.
Having a lasting stable source of supply is important as world oil demand is expected to remain strong for decades to come.
This is particularly true in Asia, the target market for oil exports off Canada’s West Coast.
The International Energy Agency (IEA) projects oil demand in the Asia-Pacific region will go from 35 million barrels per day in 2024 to 41 million barrels per day in 2050.
The growing appeal of Alberta oil in Asian markets shows up not only in expanded Trans Mountain shipments, but also in Canadian crude being “re-exported” from U.S. Gulf Coast terminals.
According to RBN Energy, Asian buyers – primarily in China – are now the main non-U.S. buyers from Trans Mountain, while India dominates purchases of re-exports from the U.S. Gulf Coast. .
BMO said the oil sands offers advantages both in steady supply and lower overall environmental impacts.
“Not only is the resulting stability ideally suited to backfill anticipated declines in world oil supply, but the long-term physical footprint may also be meaningfully lower given large-scale concentrated emissions, high water recycling rates and low well declines,” BMO analysts said.
From the Canadian Energy Centre
For Canada, the path to a stronger economy — and stronger global influence — runs through energy.
That’s the view of David Detomasi, a professor at the Smith School of Business at Queen’s University.
Detomasi, author of Profits and Power: Navigating the Politics and Geopolitics of Oil, argues that there is a moral case for developing Canada’s energy, both for Canadians and the world.

David Detomasi. Photo courtesy Smith School of Business, Queen’s University
CEC: What does being an energy superpower mean to you?
DD: It means Canada is strong enough to affect the system as a whole by its choices.
There is something really valuable about Canada’s — and Alberta’s — way of producing carbon energy that goes beyond just the monetary rewards.
CEC: You talk about the moral case for developing Canada’s energy. What do you mean?
DD: I think the default assumption in public rhetoric is that the environmental movement is the only voice speaking for the moral betterment of the world. That needs to be challenged.
That public rhetoric is that the act of cultivating a powerful, effective economic engine is somehow wrong or bad, and that efforts to create wealth are somehow morally tainted.
I think that’s dead wrong. Economic growth is morally good, and we should foster it.
Economic growth generates money, and you can’t do anything you want to do in social expenditures without that engine.
Economic growth is critical to doing all the other things we want to do as Canadians, like having a publicly funded health care system or providing transfer payments to less well-off provinces.
Over the last 10 years, many people in Canada came to equate moral leadership with getting off of oil and gas as quickly as possible. I think that is a mistake, and far too narrow.
Instead, I think moral leadership means you play that game, you play it well, and you do it in our interest, in the Canadian way.
We need a solid base of economic prosperity in this country first, and then we can help others.
CEC: Why is it important to expand Canada’s energy trade?
DD: Canada is, and has always been, a trading nation, because we’ve got a lot of geography and not that many people.
If we don’t trade what we have with the outside world, we aren’t going to be able to develop economically, because we don’t have the internal size and capacity.
Historically, most of that trade has been with the United States. Geography and history mean it will always be our primary trade partner.
But the United States clearly can be an unreliable partner. Free and open trade matters more to Canada than it does to the U.S. Indeed, a big chunk of the American people is skeptical of participating in a global trading system.
As the United States perhaps withdraws from the international trading and investment system, there’s room for Canada to reinforce it in places where we can use our resource advantages to build new, stronger relationships.
One of these is Europe, which still imports a lot of gas. We can also build positive relationships with the enormous emerging markets of China and India, both of whom want and will need enormous supplies of energy for many decades.
I would like to be able to offer partners the alternative option of buying Canadian energy so that they are less reliant on, say, Iranian or Russian energy.
Canada can also maybe eventually help the two billion people in the world currently without energy access.
CEC: What benefits could Canadians gain by becoming an energy superpower?
DD: The first and primary responsibility of our federal government is to look after Canada. At the end of the day, the goal is to improve Canada’s welfare and enhance its sovereignty.
More carbon energy development helps Canada. We have massive debt, an investment crisis and productivity problems that we’ve been talking about forever. Economic and job growth are weak.
Solving these will require profitable and productive industries. We don’t have so many economic strengths in this country that we can voluntarily ignore or constrain one of our biggest industries.
The economic benefits pay for things that make you stronger as a country.
They make you more resilient on the social welfare front and make increasing defence expenditures, which we sorely need, more affordable. It allows us to manage the debt that we’re running up, and supports deals for Canada’s Indigenous peoples.
CEC: Are there specific projects that you advocate for to make Canada an energy superpower?
DD: Canada’s energy needs egress, and getting it out to places other than the United States. That means more transport and port facilities to Canada’s coasts.
We also need domestic energy transport networks. People don’t know this, but a big chunk of Ontario’s oil supply runs through Michigan, posing a latent security risk to Ontario’s energy security.
We need to change the perception that pipelines are evil. There’s a spiderweb of them across the globe, and more are being built.
Building pipelines here, with Canadian technology and know-how, builds our competitiveness and enhances our sovereignty.
Economic growth enhances sovereignty and provides the resources to do other things. We should applaud and encourage it, and the carbon energy sector can lead the way.


Why is Canada paying for dairy ‘losses’ during a boom?

Ottawa’s Newly Released Defence Plan Crosses a Dangerous Line

Hunting Poilievre Covers For Upcoming Demographic Collapse After Boomers
Carney Floor Crossing Raises Counterintelligence Questions aimed at China, Former Senior Mountie Argues
-
 International22 hours ago
Ottawa is still dodging the China interference threat
-
 Business20 hours ago
There’s No Bias at CBC News, You Say? Well, OK…
-
 Automotive19 hours ago
Canada’s EV gamble is starting to backfire
-
 International21 hours ago
2025: The Year The Narrative Changed
-
 Fraser Institute2 days ago
Carney government sowing seeds for corruption in Ottawa
-
 Daily Caller2 days ago
While Western Nations Cling to Energy Transition, Pragmatic Nations Produce Energy and Wealth
-
 Business1 day ago
Residents in economically free states reap the rewards
-
 Alberta2 days ago
Alberta Next Panel calls for less Ottawa—and it could pay off