Fraser Institute
Australia’s universal health-care system outperforms Canada on key measures including wait times, costs less and includes large role for private hospitals


The Role of Private Hospitals in Australia’s Universal Health Care System
From the Fraser Institute
by Mackenzie Moir and Bacchus Barua
In the wake of the COVID-19 pandemic, provincial governments across Canada relied on private
clinics in order to deliver a limited number of publicly funded surgeries in a bid to clear unprecedented
surgical backlogs. Subsequently, surveys indicated that 78% of Canadians support allowing more
surgeries and tests performed in private clinics while 40% only support this policy to clear the
surgical backlog. While a majority of Canadians are either supportive (or at the very least curious)
about these arrangements, the use of private clinics continues to be controversial and raise questions
around their compatibility with the provision of universal care.
The reality is that private hospitals play a key role in delivering care to patients in other countries with universal health care. Canada is only one of 30 high-income countries with universal care and many of these countries involve the private-sector in their health-care systems to a wide extent while performing better than Canada.
Australia is one of these countries and routinely outperforms Canada on key indicators of health-care performance while spending at a similar or lower level. Like Canada, Australia ranked
in the top ten for health-care spending (as a percentage of GDP and per capita) in 2020. However, after adjusting for the age of the population, it outperforms Canada on 33 (of 36) measures of performance.
Importantly, Australia outperformed Canada on a number of key measures such as the availability of physicians, nurses, hospital beds, CT scanners, and MRI machines. Australia also outperformed
Canada on every indicator of timely access to care, including ease of access to after-hours care, same-day primary care appointments, and, crucially, timely access to elective surgical care and specialist appointments.
Australia’s universal system is also characterized by a deep integration between the public and private sectors in the financing and delivery of care. Universal health-insurance coverage is provided through its public system known as Medicare. However, Australia also has a large private health-care sector that also finances and delivers medical services. Around half of the Australian population (55.2% in 2021/22) benefit from private health-insurance coverage provided by 33 registered not-for-profit and for-profit private insurance companies.
Private hospitals (for profit and not for profit) made up nearly half (48.5%) of all Australian hospitals in 2016 and contain a third of all care beds. These hospitals are a major partner in the delivery of care in Australia. For example, in 2021/22 41% of all recorded episodes of hospital care occurred in private hospitals. While delivering a small minority of emergency care (8.2%), private hospitals delivered the majority of recorded elective care (58.6%) and 70.3% of elective admissions involving surgery.
Private hospitals primarily deliver care to fully funded public patients in two ways. The first is contracted
care, either through ad hoc inter-hospital contracts or formal programs. Fully publicly funded episodes of care occurring in private hospitals made up 6.4% of all care in private hospitals, while representing 2.6% of all recorded care. The second way is privately delivered care paid for through the Department of Veterans’ Affairs. A full 73.5% of care paid for by the Department of Veterans’ Affairs occurred in private hospitals.
It would be easy, however, to underestimate the significance of this public-private partnership by examining only the delivery of care that is fully publicly funded. Privately insured care is also partially subsidized by the government, at a rate of 75% of the public fee. Therefore, in order to understand the full extent of publicly funded or subsidized care in private hospitals, it is helpful to examine private hospital expenditures by the source of funds. In 2019/20, 32.8% of private hospital expenditures came from government sources, 18.2% of which came from private health-insurance rebates. This means that a full
third of private hospital expenditure comes from a range of public sources, including the federal government.
Overall, private hospitals are important partners in the delivery of care within the Australian universal healthcare system. The Australian system outranks Canada’s on a range of performance indicators, while spending less as a percentage of GDP. Further, the integration of private hospitals into the delivery of care, including public care, occurs while maintaining universal access for residents.
Authors:


More from this study

From the Fraser Institute
By Matthew Lau
At the beginning of June, the Canadian Dental Care Plan expanded to include all eligible adults. To be eligible, you must: not have access to dental insurance, have filed your 2024 tax return in Canada, have an adjusted family net income under $90,000, and be a Canadian resident for tax purposes.
As a result, millions more Canadians will be able to access certain dental services at reduced—or no—out-of-pocket costs, as government shoves the costs onto the backs of taxpayers. The first half of the proposition, accessing services at reduced or no out-of-pocket costs, is always popular; the second half, paying higher taxes, is less so.
A Leger poll conducted in 2022 found 72 per cent of Canadians supported a national dental program for Canadians with family incomes up to $90,000—but when asked whether they would support the program if it’s paid for by an increase in the sales tax, support fell to 42 per cent. The taxpayer burden is considerable; when first announced two years ago, the estimated price tag was $13 billion over five years, and then $4.4 billion ongoing.
Already, there are signs the final cost to taxpayers will far exceed these estimates. Dr. Maneesh Jain, the immediate past-president of the Ontario Dental Association, has pointed out that according to Health Canada the average patient saved more than $850 in out-of-pocket costs in the program’s first year. However, the Trudeau government’s initial projections in the 2023 federal budget amounted to $280 per eligible Canadian per year.
Not all eligible Canadians will necessarily access dental services every year, but the massive gap between $850 and $280 suggests the initial price tag may well have understated taxpayer costs—a habit of the federal government, which over the past decade has routinely spent above its initial projections and consistently revises its spending estimates higher with each fiscal update.
To make matters worse there are also significant administrative costs. According to a story in Canadian Affairs, “Dental associations across Canada are flagging concerns with the plan’s structure and sustainability. They say the Canadian Dental Care Plan imposes significant administrative burdens on dentists, and that the majority of eligible patients are being denied care for complex dental treatments.”
Determining eligibility and coverage is a huge burden. Canadians must first apply through the government portal, then wait weeks for Sun Life (the insurer selected by the federal government) to confirm their eligibility and coverage. Unless dentists refuse to provide treatment until they have that confirmation, they or their staff must sometimes chase down patients after the fact for any co-pay or fees not covered.
Moreover, family income determines coverage eligibility, but even if patients are enrolled in the government program, dentists may not be able to access this information quickly. This leaves dentists in what Dr. Hans Herchen, president of the Alberta Dental Association, describes as the “very awkward spot” of having to verify their patients’ family income.
Dentists must also try to explain the program, which features high rejection rates, to patients. According to Dr. Anita Gartner, president of the British Columbia Dental Association, more than half of applications for complex treatment are rejected without explanation. This reduces trust in the government program.
Finally, the program creates “moral hazard” where people are encouraged to take riskier behaviour because they do not bear the full costs. For example, while we can significantly curtail tooth decay by diligent toothbrushing and flossing, people might be encouraged to neglect these activities if their dental services are paid by taxpayers instead of out-of-pocket. It’s a principle of basic economics that socializing costs will encourage people to incur higher costs than is really appropriate (see Canada’s health-care system).
At a projected ongoing cost of $4.4 billion to taxpayers, the newly expanded national dental program is already not cheap. Alas, not only may the true taxpayer cost be much higher than this initial projection, but like many other government initiatives, the dental program already seems to be more costly than initially advertised.

Matthew Lau
Adjunct Scholar, Fraser Institute
Business
Prairie provinces and Newfoundland and Labrador see largest increases in size of government

From the Fraser Institute
By Jake Fuss and Grady Munro
A recent study found that Canada has experienced one of the largest increases in the size of government of any advanced country over the last decade. But within Canada, which provinces have led the way?
The size of government refers to the extent to which resources within the economy are controlled and directed by the government, and has important implications for economic growth, living standards, and economic freedom—the degree to which people are allowed to make their own economic choices.
Too much of anything can be harmful, and this is certainly true regarding the size of government. When government grows too large it begins to take on roles and resources that are better left to the private sector. For example, rather than focusing on core functions like maintaining the rule of law or national defence, a government that has grown too large might begin subsidizing certain businesses and industries over others (i.e. corporate welfare) in order to pick winners and losers in the market. As a result, economic growth slows and living standards are lower than they otherwise would be.
One way to measure the size of government is by calculating total general government spending as a share of the economy (GDP). General government spending refers to spending by governments at all levels (federal, provincial, and municipal), and by measuring this as a share of gross domestic product (GDP) we can compare across jurisdictions of different sizes.
A recent study compared the size of government in Canada as a whole with that of 39 other advanced economies worldwide, and found that Canada experienced the second-largest increase in the size of government (as a share of the economy) from 2014 to 2024. In other words, since 2014, governments in Canada have expanded their role within the economy faster than governments in virtually every other advanced country worldwide—including all other countries within the Group of Seven (France, Germany, Italy, Japan, the United Kingdom, and the United States). Moreover, the study showed that Canada as a whole has exceeded the optimal size of government (estimated to fall between 24 and 32 per cent of GDP) at which a country can maximize their economic growth. Beyond that point, growth slows and is lower than it otherwise would be.
However, Canada is a decentralized country and provinces vary as to the extent to which governments direct overall economic activity. Using data from Statistics Canada, the following charts illustrate which provinces in Canada have the largest size of government and which have seen the largest increases since 2014.

The chart above shows total general government spending as a share of GDP for all ten provinces in 2023 (the latest year of available provincial data). The size of government in the provinces varies considerably, ranging from a high of 61.4 per cent in Nova Scotia to a low of 30.0 per cent in Alberta. There are geographical differences, as three Atlantic provinces (Nova Scotia, Prince Edward Island, and New Brunswick) have the largest governments while the three western-most provinces (Alberta, Saskatchewan, and British Columbia) have the smallest governments. However, as of 2023, all provinces except Alberta exceeded the optimal size of government—which again, is between 24 and 32 per cent of the economy.

To show which provinces have experienced the greatest increase in the size of government in recent years, the second chart shows the percentage point increase in total general government spending as a share of GDP from 2014 to 2023. It should be noted that this is measuring the expansion of the federal government’s role in the economy—which has been substantial nationwide—as well as growth in the respective provincial and municipal governments.
The increases in the size of government since 2014 are largest in four provinces: Newfoundland and Labrador (10.82 percentage points), Alberta (7.94 percentage points), Saskatchewan (7.31 percentage points), and Manitoba (7.17 percentage points). These are all dramatic increases—for perspective, in the study referenced above, Estonia’s 6.66 percentage point increase in its size of government was the largest out of 40 advanced countries.
The remaining six provinces experienced far lower increases in the size of government, ranging from a 2.74 percentage point increase in B.C. to a 0.44 percentage point increase in Quebec. However, since 2014, every province in Canada has seen government expand its role within the economy.
Over the last decade, Canada has experienced a substantial increase in the size of total government. Within the country, Newfoundland and Labrador and the three Prairie provinces have led the way in growing their respective governments.


New Peer-Reviewed Study Affirms COVID Vaccines Reduce Fertility

Ottawa Funded the China Ferry Deal—Then Pretended to Oppose It

The permanent CO2 storage site at the end of the Alberta Carbon Trunk Line is just getting started

Canada’s euthanasia regime is not health care, but a death machine for the unwanted
-
 Alberta11 hours ago
Alberta Independence Seekers Take First Step: Citizen Initiative Application Approved, Notice of Initiative Petition Issued
-
 Crime10 hours ago
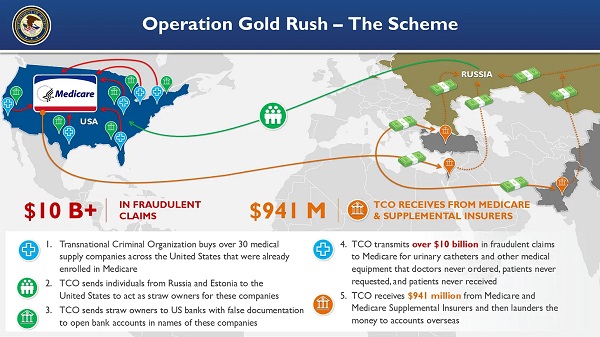
National Health Care Fraud Takedown Results in 324 Defendants Charged in Connection with Over $14.6 Billion in Alleged Fraud
-
 Health9 hours ago
RFK Jr. Unloads Disturbing Vaccine Secrets on Tucker—And Surprises Everyone on Trump
-
 Bruce Dowbiggin12 hours ago
The Game That Let Canadians Forgive The Liberals — Again
-
 Alberta1 day ago
COVID mandates protester in Canada released on bail after over 2 years in jail
-
 Crime2 days ago
Project Sleeping Giant: Inside the Chinese Mercantile Machine Linking Beijing’s Underground Banks and the Sinaloa Cartel
-
 Business1 day ago
Canada’s loyalty to globalism is bleeding our economy dry
-
 Alberta2 days ago
Alberta uncorks new rules for liquor and cannabis